OPEN-SOURCE SCRIPT
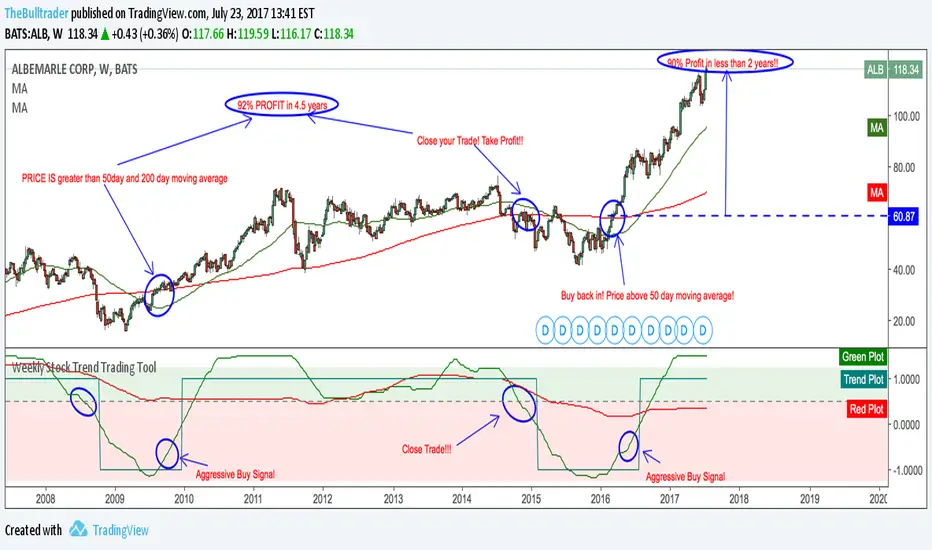
Weekly Stock Trend Trading Tool
// Created by TheBullTrader, 2017.
// Hi everyone, welcome to my Weekly Trend Trading Tool with the 50 day and 200 day moving averages
// This indicator scores each stock/ index individually and scores them on a simple scale -1.5 to +1.5
// This indicator has 2 zones: green zone = bullish, and red zone = bearish
// There are 3 plots: green = 50 day sma, red = 200 day sma, and trend signal= teal
// Buying Signal is when the green plot crosses teal plot or AGGRESSIVE Buy = green plot beginning to curve up from bearish zone.
// Sell Signal is when the green plot enters the RED ZONE
// By using this indicator as described, it will help you pick stock bottoms and COULD GET YOU OUT OF A STOCK CRASH!
// Recommendations is to scan this indicator against the top 100 US stocks with a long stock history greater than 10 years.
// I usually find 5-10 really good deals every few months. Slow and Easy way to build wealth. **Thanks for reading**
סקריפט קוד פתוח
ברוח האמיתית של TradingView, יוצר הסקריפט הזה הפך אותו לקוד פתוח, כך שסוחרים יוכלו לעיין בו ולאמת את פעולתו. כל הכבוד למחבר! אמנם ניתן להשתמש בו בחינם, אך זכור כי פרסום חוזר של הקוד כפוף ל־כללי הבית שלנו.
כתב ויתור
המידע והפרסומים אינם מיועדים להיות, ואינם מהווים, ייעוץ או המלצה פיננסית, השקעתית, מסחרית או מכל סוג אחר המסופקת או מאושרת על ידי TradingView. קרא עוד ב־תנאי השימוש.