OPEN-SOURCE SCRIPT
מעודכן Bitfinex BTC longs vs Short & Ratio

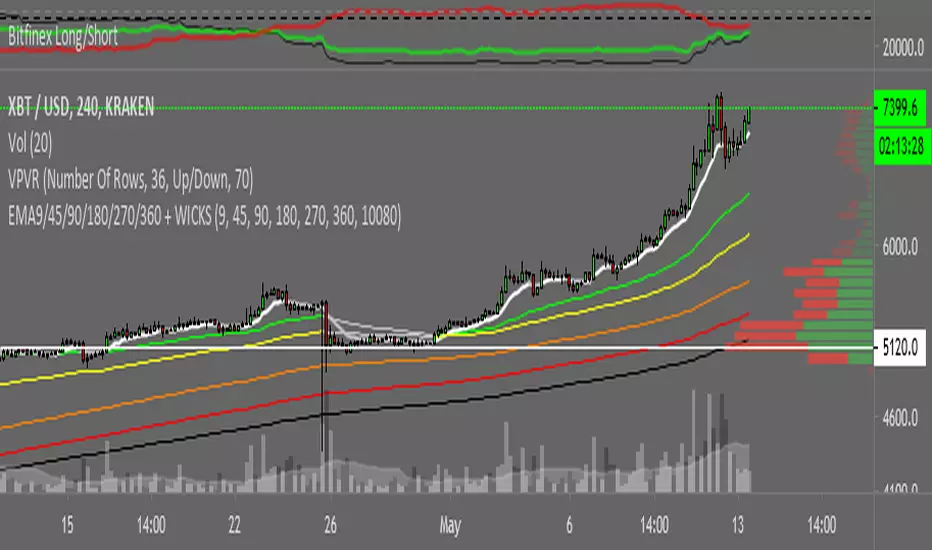
Since the last BTC Short Squeeze on Bitmex maintenance I decided to made a Indicator plotting Long:Short ratio, and their respective graphs.
Green = Longs
Red = Shorts
Black = Ratio (Longs:Shorts)*Close <= Close price just for chart normalization!
I hope you find it useful.
NOTE: It isn't a prospective indicator, but try to find out who's bitching the market and when ;p
Green = Longs
Red = Shorts
Black = Ratio (Longs:Shorts)*Close <= Close price just for chart normalization!
I hope you find it useful.
NOTE: It isn't a prospective indicator, but try to find out who's bitching the market and when ;p
הערות שחרור
#Fixed a minor bug that didn't permit to scale the Ratio when swaping charts.Working on adding some volume weighted index in here, stay aware!
הערות שחרור
#Added Treand Breakout levelהערות שחרור
Hey!I updated the script
Now it might be more accurate, since the equation was fixed to actual variables.
UPDATE:
#Black like = Open value/2 * Ratio.
This will give directionality to the Ratio, at the same time that weights the interest of the investors on BTC.
You should look for similar L/S Ratio setups to find similar PA on Bitcoin markets.
Hope you find it useful as I do.
Cheers!
סקריפט קוד פתוח
ברוח האמיתית של TradingView, יוצר הסקריפט הזה הפך אותו לקוד פתוח, כך שסוחרים יוכלו לעיין בו ולאמת את פעולתו. כל הכבוד למחבר! אמנם ניתן להשתמש בו בחינם, אך זכור כי פרסום חוזר של הקוד כפוף ל־כללי הבית שלנו.
כתב ויתור
המידע והפרסומים אינם מיועדים להיות, ואינם מהווים, ייעוץ או המלצה פיננסית, השקעתית, מסחרית או מכל סוג אחר המסופקת או מאושרת על ידי TradingView. קרא עוד ב־תנאי השימוש.