PROTECTED SOURCE SCRIPT
Entropy Percentile
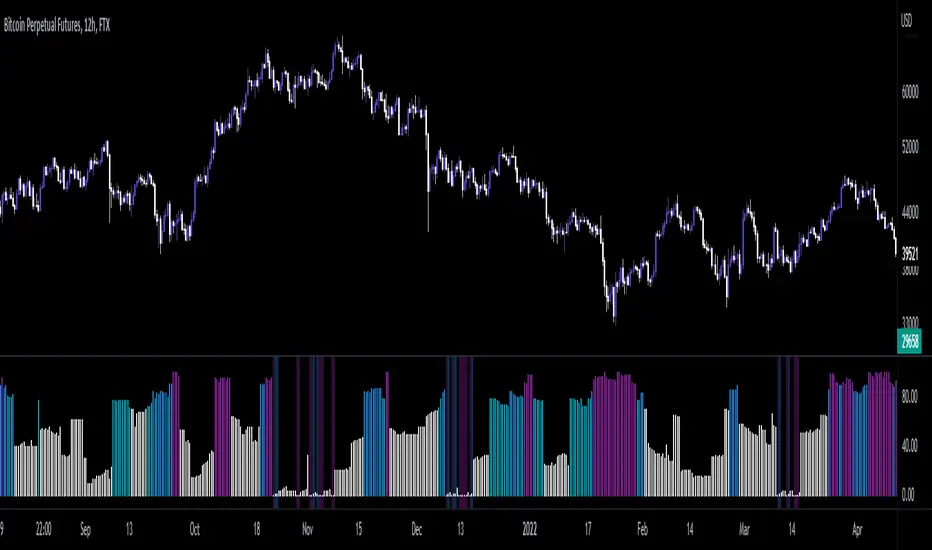
Entropy, in information theory, is the amount of info, or "uncertainty" in the possible outcomes of a variable. For example. when you flip a coin, there are two possible outcomes. That means there is one bit of entropy, as there is a chance it could land on either side, so in other words, there is "one bit of uncertainty". In trading, this can be used to help filter out when there is more or less uncertainty in the possible outcomes of the market.
This indicator takes a shannon entropy formula and applies a percent rank to get an idea of how much of past entropy was equal or lower than the current value, allowing us to see if entropy is at a significant extreme, thus giving us a method of viewing uncertainty in the log returns time series.
Put simply, this allows us to find optimal entries by showing us via background color signals when entropy is at a statistical low, showing where we may find higher probability entries.
סקריפט מוגן
סקריפט זה פורסם כמקור סגור. עם זאת, תוכל להשתמש בו בחופשיות וללא כל מגבלות – למד עוד כאן
כתב ויתור
המידע והפרסומים אינם מיועדים להיות, ואינם מהווים, ייעוץ או המלצה פיננסית, השקעתית, מסחרית או מכל סוג אחר המסופקת או מאושרת על ידי TradingView. קרא עוד ב־תנאי השימוש.
סקריפט מוגן
סקריפט זה פורסם כמקור סגור. עם זאת, תוכל להשתמש בו בחופשיות וללא כל מגבלות – למד עוד כאן
כתב ויתור
המידע והפרסומים אינם מיועדים להיות, ואינם מהווים, ייעוץ או המלצה פיננסית, השקעתית, מסחרית או מכל סוג אחר המסופקת או מאושרת על ידי TradingView. קרא עוד ב־תנאי השימוש.