OPEN-SOURCE SCRIPT
מעודכן Average Yield Inversion
Description:
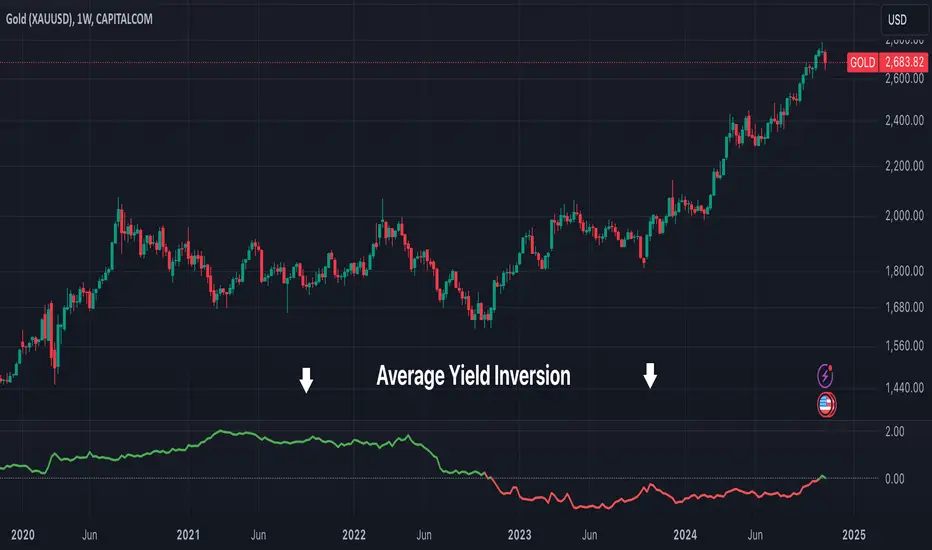
This script calculates and visualizes the average yield curve spread to identify whether the yield curve is inverted or normal. It takes into account short-term yields (1M, 3M, 6M, 2Y) and long-term yields (10Y, 30Y).
Key Features:
This tool is perfect for investors, analysts, and economists who need to monitor yield curve dynamics at a glance.
This script calculates and visualizes the average yield curve spread to identify whether the yield curve is inverted or normal. It takes into account short-term yields (1M, 3M, 6M, 2Y) and long-term yields (10Y, 30Y).
- Positive values: The curve is normal, indicating long-term yields are higher than short-term yields. This often reflects economic growth expectations.
- Negative values: The curve is inverted, meaning short-term yields are higher than long-term yields, a potential signal of economic slowdown or recession.
Key Features:
- Calculates the average spread between long-term and short-term yields.
- Displays a clear graph with a zero-line reference for quick interpretation.
- Useful for tracking macroeconomic trends and potential market turning points.
This tool is perfect for investors, analysts, and economists who need to monitor yield curve dynamics at a glance.
הערות שחרור
Added red color for inversion and green for non inversionהערות שחרור
Update: removed Chart to show the indicator onlyהערות שחרור
Update: added symbol and chart for comparisonהערות שחרור
Update: added titleסקריפט קוד פתוח
ברוח האמיתית של TradingView, יוצר הסקריפט הזה הפך אותו לקוד פתוח, כך שסוחרים יוכלו לעיין בו ולאמת את פעולתו. כל הכבוד למחבר! אמנם ניתן להשתמש בו בחינם, אך זכור כי פרסום חוזר של הקוד כפוף ל־כללי הבית שלנו.
כתב ויתור
המידע והפרסומים אינם מיועדים להיות, ואינם מהווים, ייעוץ או המלצה פיננסית, השקעתית, מסחרית או מכל סוג אחר המסופקת או מאושרת על ידי TradingView. קרא עוד ב־תנאי השימוש.
סקריפט קוד פתוח
ברוח האמיתית של TradingView, יוצר הסקריפט הזה הפך אותו לקוד פתוח, כך שסוחרים יוכלו לעיין בו ולאמת את פעולתו. כל הכבוד למחבר! אמנם ניתן להשתמש בו בחינם, אך זכור כי פרסום חוזר של הקוד כפוף ל־כללי הבית שלנו.
כתב ויתור
המידע והפרסומים אינם מיועדים להיות, ואינם מהווים, ייעוץ או המלצה פיננסית, השקעתית, מסחרית או מכל סוג אחר המסופקת או מאושרת על ידי TradingView. קרא עוד ב־תנאי השימוש.