OPEN-SOURCE SCRIPT
מעודכן range_stat

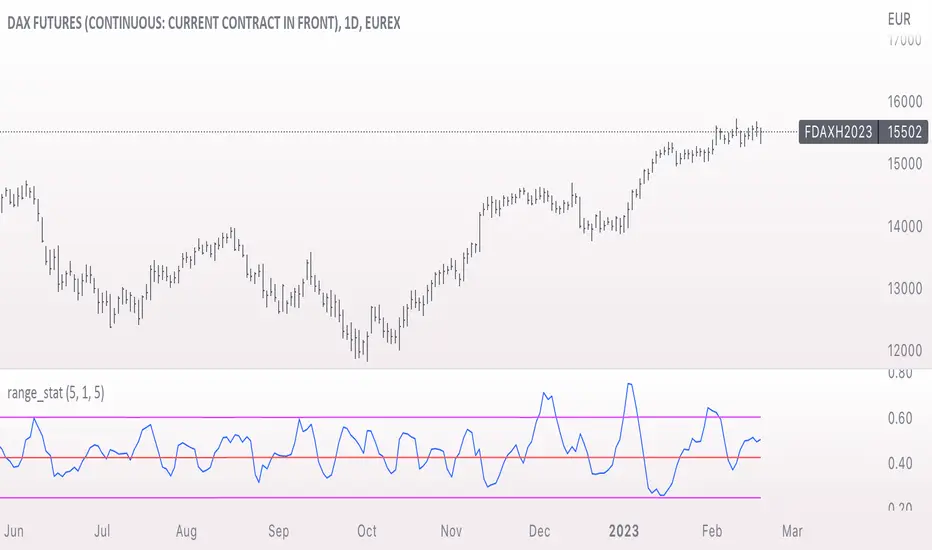
A basic statistic to describe "ranges". There are three inputs:
- short range
- long range
- moving average length
The output is a ratio of the short range to the long range. In the screenshot example, the short range is a single day (bar) and the long range is five days. A value near "1" would mean that every day entirely fills the five day range, and that a consolidation is likely present. A value near 0 would mean that each day fills only a small portion of the five day range, and price is probably "trending".
The moving average length is for smoothing the result (which also lags it of course).
The mean, and +- 2 standard deviations are plotted as fuchsia colored lines.
הערות שחרור
renamed variable and fixed chartסקריפט קוד פתוח
ברוח האמיתית של TradingView, יוצר הסקריפט הזה הפך אותו לקוד פתוח, כך שסוחרים יוכלו לעיין בו ולאמת את פעולתו. כל הכבוד למחבר! אמנם ניתן להשתמש בו בחינם, אך זכור כי פרסום חוזר של הקוד כפוף ל־כללי הבית שלנו.
כתב ויתור
המידע והפרסומים אינם מיועדים להיות, ואינם מהווים, ייעוץ או המלצה פיננסית, השקעתית, מסחרית או מכל סוג אחר המסופקת או מאושרת על ידי TradingView. קרא עוד ב־תנאי השימוש.
סקריפט קוד פתוח
ברוח האמיתית של TradingView, יוצר הסקריפט הזה הפך אותו לקוד פתוח, כך שסוחרים יוכלו לעיין בו ולאמת את פעולתו. כל הכבוד למחבר! אמנם ניתן להשתמש בו בחינם, אך זכור כי פרסום חוזר של הקוד כפוף ל־כללי הבית שלנו.
כתב ויתור
המידע והפרסומים אינם מיועדים להיות, ואינם מהווים, ייעוץ או המלצה פיננסית, השקעתית, מסחרית או מכל סוג אחר המסופקת או מאושרת על ידי TradingView. קרא עוד ב־תנאי השימוש.