OPEN-SOURCE SCRIPT
Moments Functions
This script is a TradingView Pine Script (version 5) for calculating and plotting statistical moments of a financial series. Here's a breakdown of what it does:
Script Overview
Purpose:
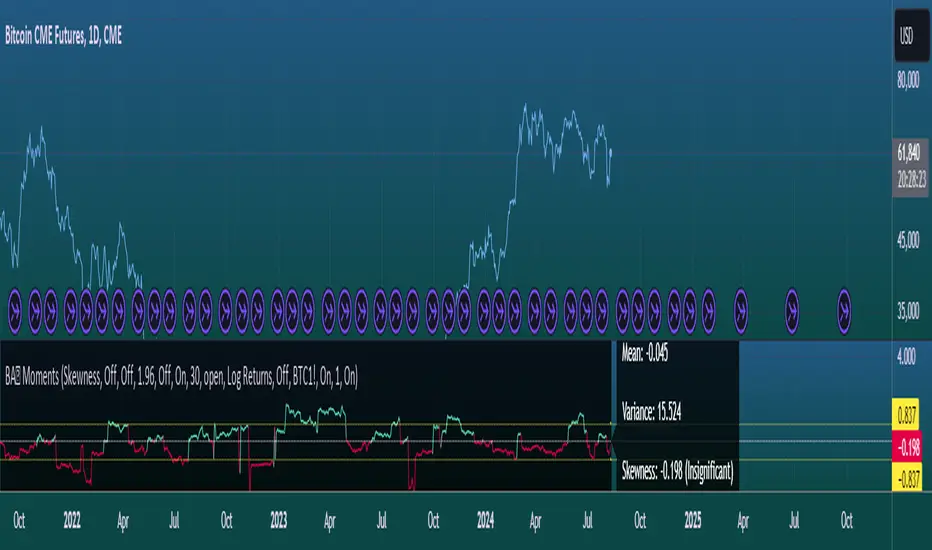
The script calculates and visualizes moments such as Mean, Variance, Skewness, and Kurtosis of a price series.
It also provides the option to display log returns and various statistical bands.
Inputs:
Moments Selection: Choose from Mean, Variance, Skewness, or Excess Kurtosis.
Source Settings: Define the lookback period and source data (e.g., closing price or log returns).
Plot Settings: Control visibility and styling of plots, bands, and information panels.
Colors Settings: Customize colors for different plot elements.
Functions:
f_va(): Computes sample variance.
f_sd(): Computes sample standard deviation.
f_skew(): Computes sample skewness.
f_kurt(): Computes sample kurtosis.
seskew(): Calculates the standard error of skewness.
sekurt(): Calculates the standard error of kurtosis.
skewcv(): Computes critical values for skewness.
kurtcv(): Computes critical values for kurtosis.
Outputs:
Plots:
Moment values (Mean, Variance, Skewness, Kurtosis).
Log Returns (if selected).
Standard Deviation Bands (if selected).
Critical Values for Skewness and Kurtosis (if selected).
Information Panel: Displays current statistical values and their significance.
Customization:
Users can customize appearance and behavior of the script through various input options, including colors, line thickness, and background settings.
Key Variables and Constants
Constants:
zscoreS and zscoreL: Z-scores for confidence intervals based on sample size.
skewrv and kurtrv: Reference values for skewness and excess kurtosis.
Sample Functions:
f_va() and f_sd(): Custom functions to calculate sample variance and standard deviation.
f_skew() and f_kurt(): Custom functions to calculate skewness and kurtosis.
Critical Values:
Functions skewcv() and kurtcv() calculate critical values used to assess statistical significance of skewness and kurtosis.
Plotting
Plot Types:
Mean, variance, skewness, and excess kurtosis are plotted based on user selection.
Log returns are plotted if enabled.
Standard deviation bands and critical values are plotted if enabled.
Labels:
Information panel labels display mean, variance/standard deviation, skewness, and kurtosis values along with their significance.
Example Usage
To use this script:
Add it to a TradingView chart.
Adjust inputs to configure which statistical moments to display, the source data, and the appearance of the plots.
Review the plotted data and labels to analyze the statistical properties of the selected price series.
This script is useful for traders and analysts looking to perform advanced statistical analysis on financial data directly within TradingView.
When comparing two stock prices over a period of time, the statistical moments—mean, variance, skewness, and kurtosis—can provide a deep insight into the behavior of the stock prices and their distributions. Here’s what each moment signifies in this context:
Definition: The mean (or average) is the sum of the stock prices over the period divided by the number of data points. It represents the central value of the price series.
Interpretation: When comparing two stocks, the mean tells you the average price level of each stock over the period. A higher mean indicates that, on average, the stock price is higher compared to another stock with a lower mean.
Comparison Insight: If Stock A has a higher mean price than Stock B, it implies that Stock A's prices are generally higher than those of Stock B over the given period.
Definition: Variance measures the dispersion or spread of the stock prices around the mean. It is the average of the squared differences from the mean.
Interpretation: A higher variance indicates that the stock prices fluctuate more widely from the mean, implying greater volatility. Conversely, a lower variance indicates more stable and predictable prices.
Comparison Insight: Comparing the variances of two stocks helps in assessing which stock has more price volatility. If Stock A has a higher variance than Stock B, it means Stock A's prices are more volatile and less predictable compared to Stock B.
Definition: Skewness measures the asymmetry of the distribution of stock prices around the mean. It can be positive, negative, or zero:
Positive Skewness: The distribution has a long right tail, with more frequent small returns and fewer large positive returns.
Negative Skewness: The distribution has a long left tail, with more frequent small returns and fewer large negative returns.
Zero Skewness: The distribution is symmetric around the mean.
Interpretation: Skewness tells you about the direction of outliers in the stock price distribution. Positive skewness means a higher probability of large positive returns, while negative skewness means a higher probability of large negative returns.
Comparison Insight: By comparing skewness, you can understand the nature of extreme returns for two stocks. For example, if Stock A has positive skewness and Stock B has negative skewness, Stock A might have more frequent large gains, whereas Stock B might have more frequent large losses.
Definition: Kurtosis measures the "tailedness" of the distribution of stock prices. It indicates how much of the distribution is in the tails versus the center. High kurtosis means more outliers (extreme returns), while low kurtosis means fewer outliers.
Interpretation:
High Kurtosis: Indicates a higher likelihood of extreme price movements (both high and low) compared to a normal distribution.
Low Kurtosis: Indicates that extreme price movements are less common.
Comparison Insight: Comparing kurtosis between two stocks shows which stock has more extreme returns. If Stock A has higher kurtosis than Stock B, it means Stock A has more frequent extreme price changes, suggesting more risk or opportunities for large gains or losses.
Summary
Mean: Compares average price levels.
Variance: Compares price volatility.
Skewness: Compares the asymmetry of price movements.
Kurtosis: Compares the likelihood of extreme price changes.
By analyzing these statistical moments, you can gain a comprehensive view of how the two stocks behave relative to each other, which can inform investment decisions based on risk, return expectations, and the nature of price movements.
סקריפט קוד פתוח
ברוח האמיתית של TradingView, יוצר הסקריפט הזה הפך אותו לקוד פתוח, כך שסוחרים יוכלו לעיין בו ולאמת את פעולתו. כל הכבוד למחבר! אמנם ניתן להשתמש בו בחינם, אך זכור כי פרסום חוזר של הקוד כפוף ל־כללי הבית שלנו.
כתב ויתור
המידע והפרסומים אינם מיועדים להיות, ואינם מהווים, ייעוץ או המלצה פיננסית, השקעתית, מסחרית או מכל סוג אחר המסופקת או מאושרת על ידי TradingView. קרא עוד ב־תנאי השימוש.