OPEN-SOURCE SCRIPT
מעודכן Debug tool - table

When having a script with lot's of values, it can be difficult to seek the values you need to debug
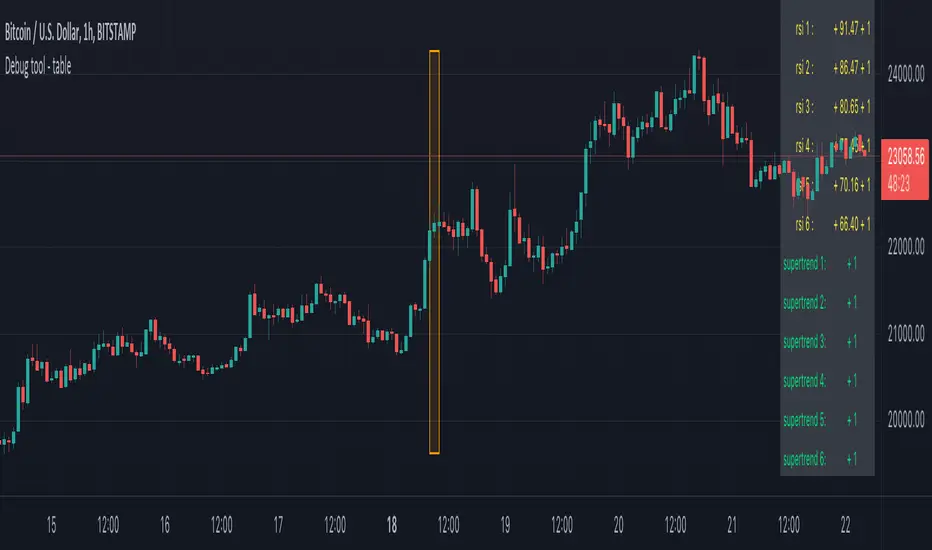
For example, here, multiple values aren't visible anymore (right side chart)

————————————————————————————————————————————————————————————————
This script show a way where you can show the values in a table on 1 particular bar, with 2 options:
1)
'middle' -> here the script uses chart.left_visible_bar_time and chart.right_visible_bar_time to calculate the middle
the values of that bar (in orange box) is shown, you can check the value by putting your mouse cursor on that bar:

Just zooming in/out, or scrolling through history will automatically show you the middle and the values of that bar.
Using the arrows on your keyboard will allow you to go 1 bar further/back each time.
(Give it some time to load though, also, sometimes you need to click anywhere on the chart before arrows start working)
2)
'time' -> settings -> Date -> the orange bar will be placed on the chosen bar, the values will be placed in the table as well.
————————————————————————————————————————————————————————————————
If the table interfere with the candles, you can alter the position without changing the placement of the orange bar -> settings -> position table
This script holds lots of values, just to show the difference between values placed on the chart, and values, placed in the table.
To make more clear how the script works, an 'example' (v_rsi1 / rsi1) is highlighted in the code itself
Cheers!
For example, here, multiple values aren't visible anymore (right side chart)
————————————————————————————————————————————————————————————————
This script show a way where you can show the values in a table on 1 particular bar, with 2 options:
1)
'middle' -> here the script uses chart.left_visible_bar_time and chart.right_visible_bar_time to calculate the middle
the values of that bar (in orange box) is shown, you can check the value by putting your mouse cursor on that bar:
Just zooming in/out, or scrolling through history will automatically show you the middle and the values of that bar.
Using the arrows on your keyboard will allow you to go 1 bar further/back each time.
(Give it some time to load though, also, sometimes you need to click anywhere on the chart before arrows start working)
2)
'time' -> settings -> Date -> the orange bar will be placed on the chosen bar, the values will be placed in the table as well.
————————————————————————————————————————————————————————————————
If the table interfere with the candles, you can alter the position without changing the placement of the orange bar -> settings -> position table
This script holds lots of values, just to show the difference between values placed on the chart, and values, placed in the table.
To make more clear how the script works, an 'example' (v_rsi1 / rsi1) is highlighted in the code itself
Cheers!
הערות שחרור
––––––––––––––––––––––––––––––––––––––––––––––––––––––––––––––––––––This script is part of a collection of educational scripts
If you want to return to the open source INDEX page, click here
-> Education: INDEX
סקריפט קוד פתוח
ברוח האמיתית של TradingView, יוצר הסקריפט הזה הפך אותו לקוד פתוח, כך שסוחרים יוכלו לעיין בו ולאמת את פעולתו. כל הכבוד למחבר! אמנם ניתן להשתמש בו בחינם, אך זכור כי פרסום חוזר של הקוד כפוף ל־כללי הבית שלנו.
Who are PineCoders?
tradingview.com/chart/SSP/yW5eOqtm-Who-are-PineCoders/
TG Pine Script® Q&A: t.me/PineCodersQA
- We cannot control our emotions,
but we can control our keyboard -
tradingview.com/chart/SSP/yW5eOqtm-Who-are-PineCoders/
TG Pine Script® Q&A: t.me/PineCodersQA
- We cannot control our emotions,
but we can control our keyboard -
כתב ויתור
המידע והפרסומים אינם מיועדים להיות, ואינם מהווים, ייעוץ או המלצה פיננסית, השקעתית, מסחרית או מכל סוג אחר המסופקת או מאושרת על ידי TradingView. קרא עוד ב־תנאי השימוש.