PROTECTED SOURCE SCRIPT
מעודכן AstroTrading_DragonCombine
1. Table Setup and User Inputs
Table Position and Font Size:
The script begins by asking the user to select a table position (e.g. Top Right) and a font size (Small, Medium, Large, Huge) via input options.
pinescript
Kopyala
positionInput = input.string("Sağ Üst Köşe", title="Tablo Konumu", options=["Sol Üst Köşe", "Sağ Üst Köşe", "Sol Alt Köşe", "Sağ Alt Köşe"])
fontSizeInput = input.string("Orta", title="Yazı Punto Büyüklüğü", options=["Küçük", "Orta", "Büyük", "Çok Büyük"])
Table Creation:
A table is created using table.new with 6 rows and 4 columns. The location of the table is determined by the selected input. This table will later display the name, entry, target, and stop levels for each of the five strategies.
2. Variable Declarations
The script defines several persistent variables to store levels for each indicator. These include:
Entry, target, and stop levels for each of the five sub-indicators (labeled as _1, _2, _3, _4, and _5).
Examples include targetLevel_1, fibLow_1, lastEntry_1, lastTarget_1, etc.
3. Indicator 1 – AstroTrading_AlphaBalance
Logic:
This part examines the previous candle’s high and low to compute its range. It then defines two conditions:
conditionUp_1: When the current close exceeds the previous high by at least 50% of the previous range.
conditionDown_1: When the current close falls below the previous low by 50% of the previous range.
Action:
Depending on whether the move is upward or downward, the script sets:
For an upward move:
fibLow_1 is set to the current low.
The entry level is taken as the current high.
The target is computed by taking the high and subtracting –0.786 times the range (this negative multiplier inverts the move).
The stop is set at the previous low.
For a downward move, similar logic applies with reversed roles.
Purpose:
This module generates a primary signal (AlphaBalance) based on extreme candle movements relative to the prior candle’s range.
4. Indicator 2 – AstroTrading_CandleElongation
Higher Timeframe Data:
The script uses the request.security function to obtain high, low, close, and open values from a user-specified timeframe.
Fibonacci Extension Calculation:
A function fiboExtension calculates two Fibonacci extension levels (approximately 0.786 and 1.618 multipliers) based on three price points.
Signal Conditions:
It checks if the previous candle (two bars ago) meets certain criteria relative to its open, and if the current candle’s close confirms an elongation move.
Output:
If conditions are met, the script sets:
candleEntry_2 to the lower Fibonacci level,
candleTarget_2 to the higher Fibonacci extension,
candleStop_2 to the current low (for a bullish setup) or high (for bearish).
Purpose:
This sub-indicator looks to capture significant candle elongation moves by using Fibonacci extension levels to define entry, target, and stop.
5. Indicator 3 – AstroTrading_FlaGama
Similar to a Flag Formation:
Like the previous “FlaGama” indicator, it checks if the current close is more than 50% beyond the previous candle’s high (conditionUp_3) or below the previous low (conditionDown_3).
Bar Coloring:
If either condition is met, the bar is colored orange to signal an extreme move.
Signal Generation:
Depending on the move’s direction:
Bullish Setup:
Calculates a Fibonacci level at 78.6% from the current low to high.
Sets the entry at this Fibonacci level.
The target is computed by adding the difference between the current high and the Fibonacci level to the current high.
The stop is set at the current low.
Bearish Setup:
Mirrors the Fibonacci calculation to derive a level for short entry.
The target is set below the current low, and the stop is at the current high.
Purpose:
The FlaGama section provides confirmation signals when extreme moves occur, helping traders decide on potential reversals.
6. Indicator 4 – AstroTrading_HermDown
EMA Crossover:
An EMA (111-period) is calculated. A crossover of the EMA above the close triggers a “kesilme” (cutoff) event.
First Candle Identification:
Once a crossover is detected, the next candle’s close is monitored. If that candle’s close remains below the cutoff level, it is considered the “first candle” of the HermDown setup.
Fibonacci Retracement:
It then calculates the highest high over the last 30 bars and derives a target level (fibNeg0618_4) at about 48.6% retracement from that high.
Signal Levels:
The entry is the cutoff close, the target is the calculated Fibonacci level, and the stop is the low of the cutoff candle.
Purpose:
This module aims to capture bearish reversals (HermDown) when the price drops sharply below an EMA, using Fibonacci retracement as a guide.
7. Indicator 5 – AstroTrading_HermUp
EMA Crossunder:
Similarly, an EMA (111-period) is used. A crossunder (EMA crossing below the close) signals a potential bullish reversal.
First Candle Confirmation:
The next candle’s close is checked to confirm the move.
Fibonacci Level:
A Fibonacci extension (approximately 61.8% of the distance from the cutoff close to the high) is computed to serve as the target.
Signal Levels:
The entry is set at the cutoff close, the target is the Fibonacci level, and the stop is set at the low.
Purpose:
This section captures bullish reversal signals (HermUp) when the price moves above an EMA.
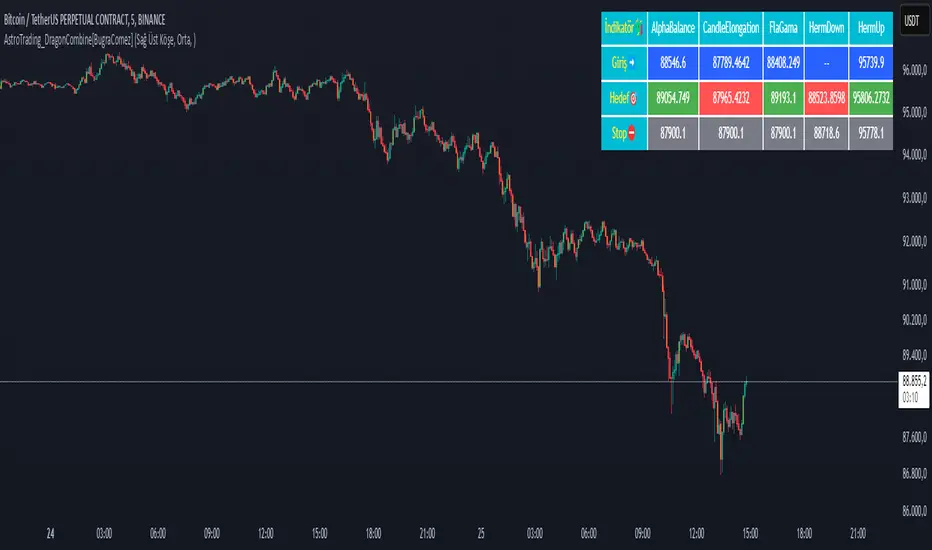
8. Displaying Levels in a Table
Aggregating Data:
The script gathers the entry, target, and stop levels from all five sub-indicators.
Table Layout:
The table displays five rows (one for each indicator) with four columns:
Indicator name (e.g., “AlphaBalance”, “CandleElongation”, “FlaGama”, “HermDown”, “HermUp”)
Entry level
Target level
Stop level
Color Coding:
Entry cells have a blue background.
Target cells are colored green if above the current close or red if below.
Stop cells are given a gray background.
Purpose:
This consolidated view allows traders to quickly assess all key levels from different strategies on the chart.
Summary
The “AstroTrading_DragonCombine” indicator is a multi-faceted tool that merges five distinct trading setups into one comprehensive display. Each sub-indicator utilizes a unique method—ranging from extreme candle moves and Fibonacci extensions to EMA crossovers—to determine entry, target, and stop levels. These levels are then neatly summarized in a table overlay on the chart. By combining these approaches, traders can gain a broader perspective on market conditions and potential reversal points, enhancing their decision-making process while adhering to sound risk management principles.
This explanation is written to meet TradingView’s script publication standards, providing a clear, objective, and detailed overview of the indicator’s functionality and logic.
Table Position and Font Size:
The script begins by asking the user to select a table position (e.g. Top Right) and a font size (Small, Medium, Large, Huge) via input options.
pinescript
Kopyala
positionInput = input.string("Sağ Üst Köşe", title="Tablo Konumu", options=["Sol Üst Köşe", "Sağ Üst Köşe", "Sol Alt Köşe", "Sağ Alt Köşe"])
fontSizeInput = input.string("Orta", title="Yazı Punto Büyüklüğü", options=["Küçük", "Orta", "Büyük", "Çok Büyük"])
Table Creation:
A table is created using table.new with 6 rows and 4 columns. The location of the table is determined by the selected input. This table will later display the name, entry, target, and stop levels for each of the five strategies.
2. Variable Declarations
The script defines several persistent variables to store levels for each indicator. These include:
Entry, target, and stop levels for each of the five sub-indicators (labeled as _1, _2, _3, _4, and _5).
Examples include targetLevel_1, fibLow_1, lastEntry_1, lastTarget_1, etc.
3. Indicator 1 – AstroTrading_AlphaBalance
Logic:
This part examines the previous candle’s high and low to compute its range. It then defines two conditions:
conditionUp_1: When the current close exceeds the previous high by at least 50% of the previous range.
conditionDown_1: When the current close falls below the previous low by 50% of the previous range.
Action:
Depending on whether the move is upward or downward, the script sets:
For an upward move:
fibLow_1 is set to the current low.
The entry level is taken as the current high.
The target is computed by taking the high and subtracting –0.786 times the range (this negative multiplier inverts the move).
The stop is set at the previous low.
For a downward move, similar logic applies with reversed roles.
Purpose:
This module generates a primary signal (AlphaBalance) based on extreme candle movements relative to the prior candle’s range.
4. Indicator 2 – AstroTrading_CandleElongation
Higher Timeframe Data:
The script uses the request.security function to obtain high, low, close, and open values from a user-specified timeframe.
Fibonacci Extension Calculation:
A function fiboExtension calculates two Fibonacci extension levels (approximately 0.786 and 1.618 multipliers) based on three price points.
Signal Conditions:
It checks if the previous candle (two bars ago) meets certain criteria relative to its open, and if the current candle’s close confirms an elongation move.
Output:
If conditions are met, the script sets:
candleEntry_2 to the lower Fibonacci level,
candleTarget_2 to the higher Fibonacci extension,
candleStop_2 to the current low (for a bullish setup) or high (for bearish).
Purpose:
This sub-indicator looks to capture significant candle elongation moves by using Fibonacci extension levels to define entry, target, and stop.
5. Indicator 3 – AstroTrading_FlaGama
Similar to a Flag Formation:
Like the previous “FlaGama” indicator, it checks if the current close is more than 50% beyond the previous candle’s high (conditionUp_3) or below the previous low (conditionDown_3).
Bar Coloring:
If either condition is met, the bar is colored orange to signal an extreme move.
Signal Generation:
Depending on the move’s direction:
Bullish Setup:
Calculates a Fibonacci level at 78.6% from the current low to high.
Sets the entry at this Fibonacci level.
The target is computed by adding the difference between the current high and the Fibonacci level to the current high.
The stop is set at the current low.
Bearish Setup:
Mirrors the Fibonacci calculation to derive a level for short entry.
The target is set below the current low, and the stop is at the current high.
Purpose:
The FlaGama section provides confirmation signals when extreme moves occur, helping traders decide on potential reversals.
6. Indicator 4 – AstroTrading_HermDown
EMA Crossover:
An EMA (111-period) is calculated. A crossover of the EMA above the close triggers a “kesilme” (cutoff) event.
First Candle Identification:
Once a crossover is detected, the next candle’s close is monitored. If that candle’s close remains below the cutoff level, it is considered the “first candle” of the HermDown setup.
Fibonacci Retracement:
It then calculates the highest high over the last 30 bars and derives a target level (fibNeg0618_4) at about 48.6% retracement from that high.
Signal Levels:
The entry is the cutoff close, the target is the calculated Fibonacci level, and the stop is the low of the cutoff candle.
Purpose:
This module aims to capture bearish reversals (HermDown) when the price drops sharply below an EMA, using Fibonacci retracement as a guide.
7. Indicator 5 – AstroTrading_HermUp
EMA Crossunder:
Similarly, an EMA (111-period) is used. A crossunder (EMA crossing below the close) signals a potential bullish reversal.
First Candle Confirmation:
The next candle’s close is checked to confirm the move.
Fibonacci Level:
A Fibonacci extension (approximately 61.8% of the distance from the cutoff close to the high) is computed to serve as the target.
Signal Levels:
The entry is set at the cutoff close, the target is the Fibonacci level, and the stop is set at the low.
Purpose:
This section captures bullish reversal signals (HermUp) when the price moves above an EMA.
8. Displaying Levels in a Table
Aggregating Data:
The script gathers the entry, target, and stop levels from all five sub-indicators.
Table Layout:
The table displays five rows (one for each indicator) with four columns:
Indicator name (e.g., “AlphaBalance”, “CandleElongation”, “FlaGama”, “HermDown”, “HermUp”)
Entry level
Target level
Stop level
Color Coding:
Entry cells have a blue background.
Target cells are colored green if above the current close or red if below.
Stop cells are given a gray background.
Purpose:
This consolidated view allows traders to quickly assess all key levels from different strategies on the chart.
Summary
The “AstroTrading_DragonCombine” indicator is a multi-faceted tool that merges five distinct trading setups into one comprehensive display. Each sub-indicator utilizes a unique method—ranging from extreme candle moves and Fibonacci extensions to EMA crossovers—to determine entry, target, and stop levels. These levels are then neatly summarized in a table overlay on the chart. By combining these approaches, traders can gain a broader perspective on market conditions and potential reversal points, enhancing their decision-making process while adhering to sound risk management principles.
This explanation is written to meet TradingView’s script publication standards, providing a clear, objective, and detailed overview of the indicator’s functionality and logic.
הערות שחרור
1. Table Setup and User InputsTable Position and Font Size:
The script begins by asking the user to select a table position (e.g. Top Right) and a font size (Small, Medium, Large, Huge) via input options.
pinescript
Kopyala
positionInput = input.string("Sağ Üst Köşe", title="Tablo Konumu", options=["Sol Üst Köşe", "Sağ Üst Köşe", "Sol Alt Köşe", "Sağ Alt Köşe"])
fontSizeInput = input.string("Orta", title="Yazı Punto Büyüklüğü", options=["Küçük", "Orta", "Büyük", "Çok Büyük"])
Table Creation:
A table is created using table.new with 6 rows and 4 columns. The location of the table is determined by the selected input. This table will later display the name, entry, target, and stop levels for each of the five strategies.
2. Variable Declarations
The script defines several persistent variables to store levels for each indicator. These include:
Entry, target, and stop levels for each of the five sub-indicators (labeled as _1, _2, _3, _4, and _5).
Examples include targetLevel_1, fibLow_1, lastEntry_1, lastTarget_1, etc.
3. Indicator 1 – AstroTrading_AlphaBalance
Logic:
This part examines the previous candle’s high and low to compute its range. It then defines two conditions:
conditionUp_1: When the current close exceeds the previous high by at least 50% of the previous range.
conditionDown_1: When the current close falls below the previous low by 50% of the previous range.
Action:
Depending on whether the move is upward or downward, the script sets:
For an upward move:
fibLow_1 is set to the current low.
The entry level is taken as the current high.
The target is computed by taking the high and subtracting –0.786 times the range (this negative multiplier inverts the move).
The stop is set at the previous low.
For a downward move, similar logic applies with reversed roles.
Purpose:
This module generates a primary signal (AlphaBalance) based on extreme candle movements relative to the prior candle’s range.
4. Indicator 2 – AstroTrading_CandleElongation
Higher Timeframe Data:
The script uses the request.security function to obtain high, low, close, and open values from a user-specified timeframe.
Fibonacci Extension Calculation:
A function fiboExtension calculates two Fibonacci extension levels (approximately 0.786 and 1.618 multipliers) based on three price points.
Signal Conditions:
It checks if the previous candle (two bars ago) meets certain criteria relative to its open, and if the current candle’s close confirms an elongation move.
Output:
If conditions are met, the script sets:
candleEntry_2 to the lower Fibonacci level,
candleTarget_2 to the higher Fibonacci extension,
candleStop_2 to the current low (for a bullish setup) or high (for bearish).
Purpose:
This sub-indicator looks to capture significant candle elongation moves by using Fibonacci extension levels to define entry, target, and stop.
5. Indicator 3 – AstroTrading_FlaGama
Similar to a Flag Formation:
Like the previous “FlaGama” indicator, it checks if the current close is more than 50% beyond the previous candle’s high (conditionUp_3) or below the previous low (conditionDown_3).
Bar Coloring:
If either condition is met, the bar is colored orange to signal an extreme move.
Signal Generation:
Depending on the move’s direction:
Bullish Setup:
Calculates a Fibonacci level at 78.6% from the current low to high.
Sets the entry at this Fibonacci level.
The target is computed by adding the difference between the current high and the Fibonacci level to the current high.
The stop is set at the current low.
Bearish Setup:
Mirrors the Fibonacci calculation to derive a level for short entry.
The target is set below the current low, and the stop is at the current high.
Purpose:
The FlaGama section provides confirmation signals when extreme moves occur, helping traders decide on potential reversals.
6. Indicator 4 – AstroTrading_HermDown
EMA Crossover:
An EMA (111-period) is calculated. A crossover of the EMA above the close triggers a “kesilme” (cutoff) event.
First Candle Identification:
Once a crossover is detected, the next candle’s close is monitored. If that candle’s close remains below the cutoff level, it is considered the “first candle” of the HermDown setup.
Fibonacci Retracement:
It then calculates the highest high over the last 30 bars and derives a target level (fibNeg0618_4) at about 48.6% retracement from that high.
Signal Levels:
The entry is the cutoff close, the target is the calculated Fibonacci level, and the stop is the low of the cutoff candle.
Purpose:
This module aims to capture bearish reversals (HermDown) when the price drops sharply below an EMA, using Fibonacci retracement as a guide.
7. Indicator 5 – AstroTrading_HermUp
EMA Crossunder:
Similarly, an EMA (111-period) is used. A crossunder (EMA crossing below the close) signals a potential bullish reversal.
First Candle Confirmation:
The next candle’s close is checked to confirm the move.
Fibonacci Level:
A Fibonacci extension (approximately 61.8% of the distance from the cutoff close to the high) is computed to serve as the target.
Signal Levels:
The entry is set at the cutoff close, the target is the Fibonacci level, and the stop is set at the low.
Purpose:
This section captures bullish reversal signals (HermUp) when the price moves above an EMA.
8. Displaying Levels in a Table
Aggregating Data:
The script gathers the entry, target, and stop levels from all five sub-indicators.
Table Layout:
The table displays five rows (one for each indicator) with four columns:
Indicator name (e.g., “AlphaBalance”, “CandleElongation”, “FlaGama”, “HermDown”, “HermUp”)
Entry level
Target level
Stop level
Color Coding:
Entry cells have a blue background.
Target cells are colored green if above the current close or red if below.
Stop cells are given a gray background.
Purpose:
This consolidated view allows traders to quickly assess all key levels from different strategies on the chart.
Summary
The “AstroTrading_DragonCombine” indicator is a multi-faceted tool that merges five distinct trading setups into one comprehensive display. Each sub-indicator utilizes a unique method—ranging from extreme candle moves and Fibonacci extensions to EMA crossovers—to determine entry, target, and stop levels. These levels are then neatly summarized in a table overlay on the chart. By combining these approaches, traders can gain a broader perspective on market conditions and potential reversal points, enhancing their decision-making process while adhering to sound risk management principles.
This explanation is written to meet TradingView’s script publication standards, providing a clear, objective, and detailed overview of the indicator’s functionality and logic.
סקריפט מוגן
סקריפט זה פורסם כמקור סגור. עם זאת, תוכל להשתמש בו בחופשיות וללא כל מגבלות – למד עוד כאן
כתב ויתור
המידע והפרסומים אינם מיועדים להיות, ואינם מהווים, ייעוץ או המלצה פיננסית, השקעתית, מסחרית או מכל סוג אחר המסופקת או מאושרת על ידי TradingView. קרא עוד ב־תנאי השימוש.
סקריפט מוגן
סקריפט זה פורסם כמקור סגור. עם זאת, תוכל להשתמש בו בחופשיות וללא כל מגבלות – למד עוד כאן
כתב ויתור
המידע והפרסומים אינם מיועדים להיות, ואינם מהווים, ייעוץ או המלצה פיננסית, השקעתית, מסחרית או מכל סוג אחר המסופקת או מאושרת על ידי TradingView. קרא עוד ב־תנאי השימוש.