OPEN-SOURCE SCRIPT
מעודכן D-VaR position sizing

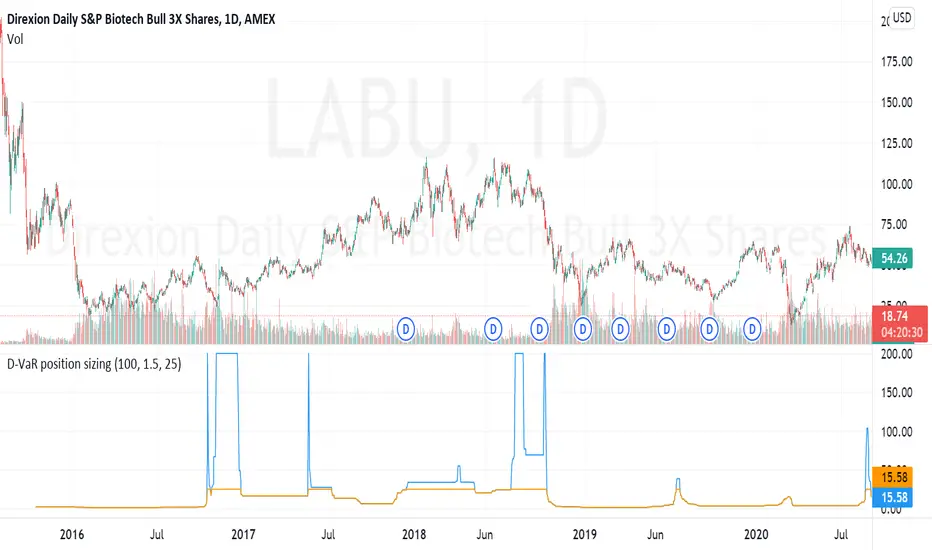
The D-VaR position sizing method was created by David Varadi. It's based on the concept of Value at Risk (VaR) - a widely used measure of the risk of loss in a portfolio based on the statistical analysis of historical price trends and volatilities. You can set the Percent Risk between 1 (lower) and 1.5 (higher); as well as, cap the % of Equity used in the position. The indicator plots the % of equity recommended based on the parameters you set.
הערות שחרור
Fixed error in percentile_rank formula where it was not accounting for rolling returns. Added a cap of 200% of max equity to position size to limit plot size run-up and reduce exposure to large DVAR calculation when tail-size is extremely small number (i.e. 0.0001, etc.).סקריפט קוד פתוח
ברוח האמיתית של TradingView, יוצר הסקריפט הזה הפך אותו לקוד פתוח, כך שסוחרים יוכלו לעיין בו ולאמת את פעולתו. כל הכבוד למחבר! אמנם ניתן להשתמש בו בחינם, אך זכור כי פרסום חוזר של הקוד כפוף ל־כללי הבית שלנו.
Need seasonals for futures data on NQ, ES, YM, or other commodities. Check out agresticresearch.com.
כתב ויתור
המידע והפרסומים אינם מיועדים להיות, ואינם מהווים, ייעוץ או המלצה פיננסית, השקעתית, מסחרית או מכל סוג אחר המסופקת או מאושרת על ידי TradingView. קרא עוד ב־תנאי השימוש.
סקריפט קוד פתוח
ברוח האמיתית של TradingView, יוצר הסקריפט הזה הפך אותו לקוד פתוח, כך שסוחרים יוכלו לעיין בו ולאמת את פעולתו. כל הכבוד למחבר! אמנם ניתן להשתמש בו בחינם, אך זכור כי פרסום חוזר של הקוד כפוף ל־כללי הבית שלנו.
Need seasonals for futures data on NQ, ES, YM, or other commodities. Check out agresticresearch.com.
כתב ויתור
המידע והפרסומים אינם מיועדים להיות, ואינם מהווים, ייעוץ או המלצה פיננסית, השקעתית, מסחרית או מכל סוג אחר המסופקת או מאושרת על ידי TradingView. קרא עוד ב־תנאי השימוש.