OPEN-SOURCE SCRIPT
מעודכן Donchian Channel Trend Intensity [DW]

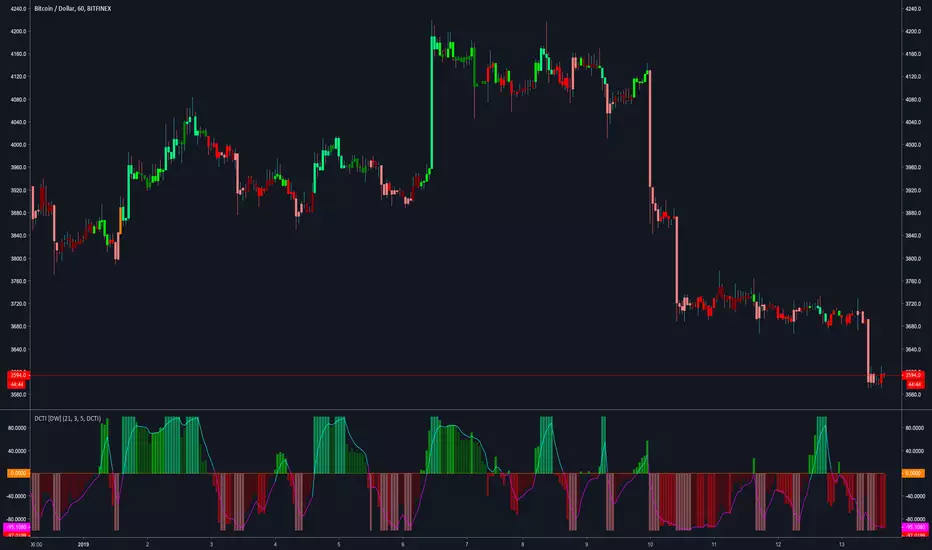
This is an experimental study designed to analyze trend intensity using two Donchian Channels.
The DCTI curve is calculated by comparing the differences between Donchian highs and lows over a major an minor period, and expressing them as a positive and negative percentage.
The curve is then smoothed with an exponential moving average to provide a signal line.
Custom bar colors included with two coloring methods to choose from.
הערות שחרור
Updates:Cleaned up the code. Condensed the operations into a function.
Bar color selection is now an easy to use dropdown menu.
סקריפט קוד פתוח
ברוח האמיתית של TradingView, יוצר הסקריפט הזה הפך אותו לקוד פתוח, כך שסוחרים יוכלו לעיין בו ולאמת את פעולתו. כל הכבוד למחבר! אמנם ניתן להשתמש בו בחינם, אך זכור כי פרסום חוזר של הקוד כפוף ל־כללי הבית שלנו.
For my full list of premium tools, check the blog:
wallanalytics.com/
Reach out on Telegram:
t.me/DonovanWall
wallanalytics.com/
Reach out on Telegram:
t.me/DonovanWall
כתב ויתור
המידע והפרסומים אינם מיועדים להיות, ואינם מהווים, ייעוץ או המלצה פיננסית, השקעתית, מסחרית או מכל סוג אחר המסופקת או מאושרת על ידי TradingView. קרא עוד ב־תנאי השימוש.