OPEN-SOURCE SCRIPT
Candle and BG Trend Identifier

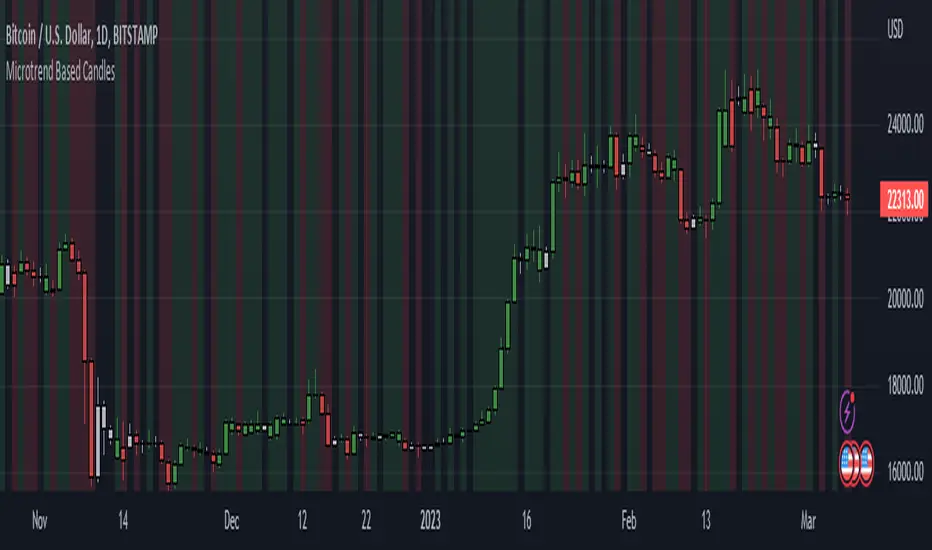
This indicator simply changes the background and color of candle based on the previous candle's close. If a candle closes high than the previous candle's high it will be indicated via green coloring. If a candle closes lower than the previous candle's low it will be indicated in red coloring. Additionally, grey colored candles appear when neither occur - often signifying consolidation.
These candles can be used to identify previous small lasting and long ranging trends. Areas that are heavily saturated with one specific color will likely indicate a trend.
If you are not able to see the colored candles, disable your main candle overlay in the top left by clicking on the eye icon.
These candles can be used to identify previous small lasting and long ranging trends. Areas that are heavily saturated with one specific color will likely indicate a trend.
If you are not able to see the colored candles, disable your main candle overlay in the top left by clicking on the eye icon.
סקריפט קוד פתוח
ברוח האמיתית של TradingView, יוצר הסקריפט הזה הפך אותו לקוד פתוח, כך שסוחרים יוכלו לעיין בו ולאמת את פעולתו. כל הכבוד למחבר! אמנם ניתן להשתמש בו בחינם, אך זכור כי פרסום חוזר של הקוד כפוף ל־כללי הבית שלנו.
כתב ויתור
המידע והפרסומים אינם מיועדים להיות, ואינם מהווים, ייעוץ או המלצה פיננסית, השקעתית, מסחרית או מכל סוג אחר המסופקת או מאושרת על ידי TradingView. קרא עוד ב־תנאי השימוש.