OPEN-SOURCE SCRIPT
Hull Differential [kingthies_]
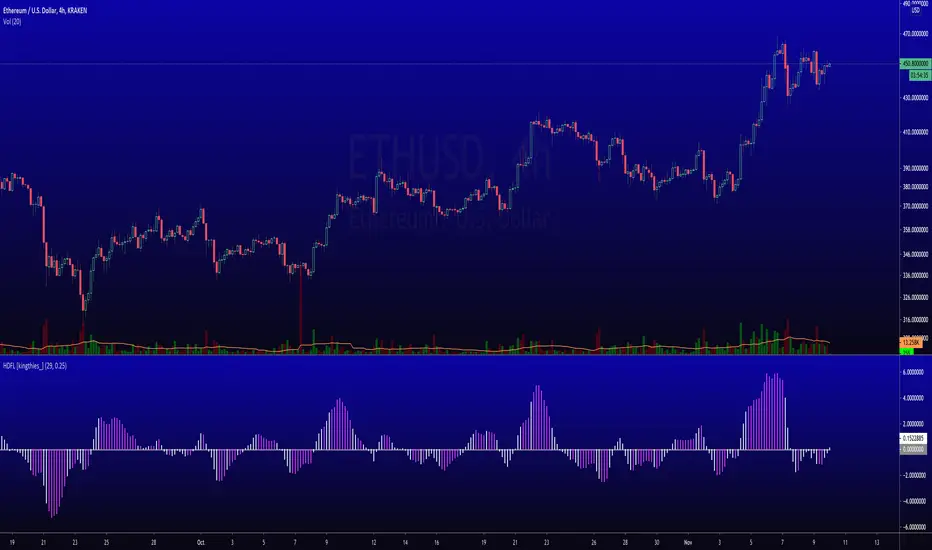
This adaptation of a Hull-MA mimics the calculation of a hull-moving average, in comparison to its most recent three periods. Ultimately, this leading plot will cross 0 to signify bull control, and likewise to cross beneath zero when negative. Fuchisa coloring after a white cross can signify a change in trend may be near, which is essentially a divergence to either side.
סקריפט קוד פתוח
ברוח האמיתית של TradingView, יוצר הסקריפט הזה הפך אותו לקוד פתוח, כך שסוחרים יוכלו לעיין בו ולאמת את פעולתו. כל הכבוד למחבר! אמנם ניתן להשתמש בו בחינם, אך זכור כי פרסום חוזר של הקוד כפוף ל־כללי הבית שלנו.
Eric Thies
כתב ויתור
המידע והפרסומים אינם מיועדים להיות, ואינם מהווים, ייעוץ או המלצה פיננסית, השקעתית, מסחרית או מכל סוג אחר המסופקת או מאושרת על ידי TradingView. קרא עוד ב־תנאי השימוש.