OPEN-SOURCE SCRIPT
Median CrossOver Levels
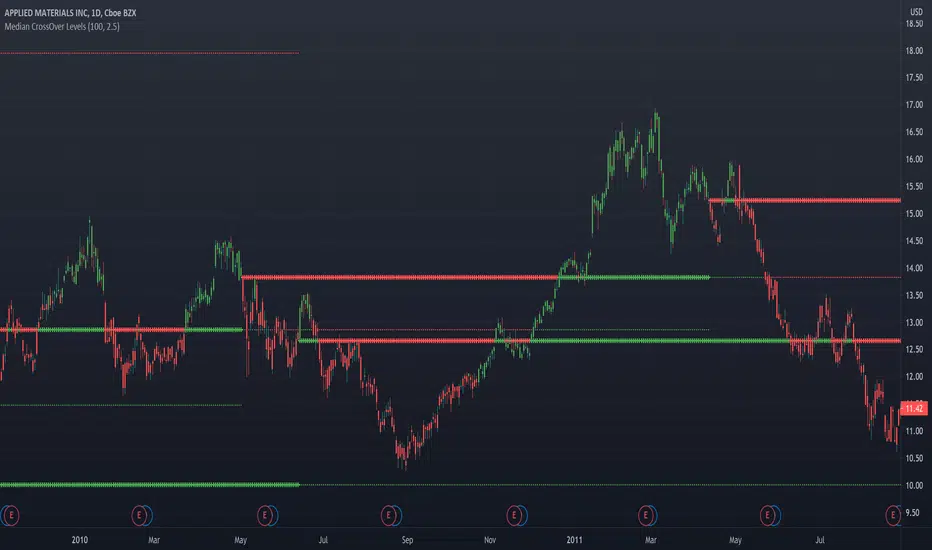
Plots levels representing the prices that the stock closed above its n-period moving median(default=100).
2 thickest lines represents the two most recent crossover levels.
Candles are colored green if the price is currently above its moving median and red if below.
2 thickest lines represents the two most recent crossover levels.
Candles are colored green if the price is currently above its moving median and red if below.
סקריפט קוד פתוח
ברוח האמיתית של TradingView, יוצר הסקריפט הזה הפך אותו לקוד פתוח, כך שסוחרים יוכלו לעיין בו ולאמת את פעולתו. כל הכבוד למחבר! אמנם ניתן להשתמש בו בחינם, אך זכור כי פרסום חוזר של הקוד כפוף ל־כללי הבית שלנו.
כתב ויתור
המידע והפרסומים אינם מיועדים להיות, ואינם מהווים, ייעוץ או המלצה פיננסית, השקעתית, מסחרית או מכל סוג אחר המסופקת או מאושרת על ידי TradingView. קרא עוד ב־תנאי השימוש.