OPEN-SOURCE SCRIPT
NSE Bank Nifty - Constituent Strength
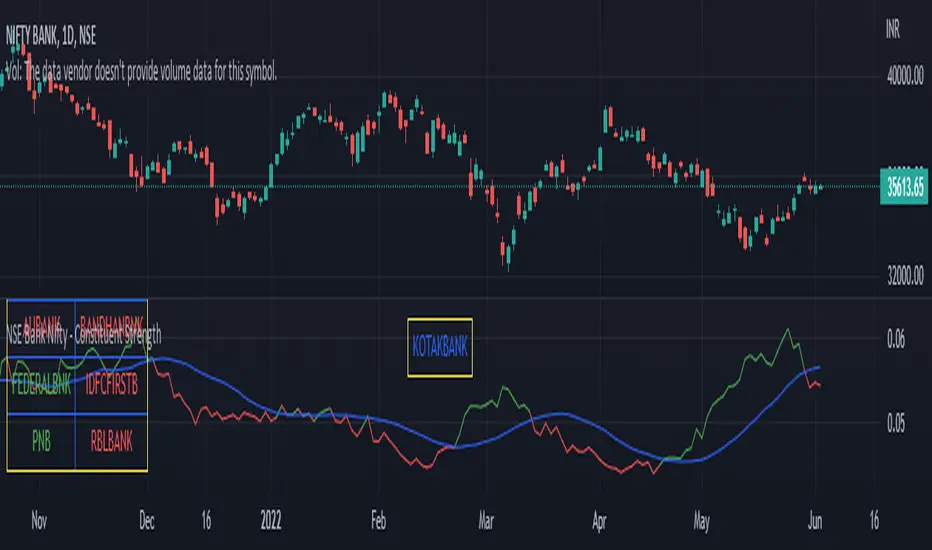
NSE Bank Nifty - Constituent Strength
What is does:
Identifies how stocks under bank nifty index are performing if compared with bank nifty index.
Calculations:
A = Individual stock price
B = Bank nifty index price
C = A / B
D = average of A / B over length specified using input configuration
Stock is out-performing Bank nifty if A >= C
Stock is under-performing Bank nifty if A < C
Input Parameters:
Data source - For calculation of strength
Timeframe - For calculation of strength
Moving average type - SMA or EMA
Moving average length - Length for calculation of moving average
Show line chart for - One of the symbol from index constituents for showing line chart in the indicator window
S1 to S12 - Bank nifty stocks. Populated by default
Output:
Table listing each of the Bank nifty stocks
Stocks displayed in Green color are out-performing Bank nifty
Stocks displayed in Red color are under-performing Bank nifty
Line chart Price line - Blue colored line representing Stock price / Bank nifty price [point C from Calculations sections above]
Line chart Average line - Combination of Red, Green and Blue colors line representing average of Stock price / average of Bank nifty price [point D from Calculations sections above]
סקריפט קוד פתוח
ברוח TradingView אמיתית, מחבר הסקריפט הזה פרסם אותו בקוד פתוח, כך שסוחרים יוכלו להבין ולאמת אותו. כל הכבוד למחבר! אתה יכול להשתמש בו בחינם, אבל השימוש החוזר בקוד זה בפרסום כפוף לכללי הבית. אתה יכול להכניס אותו למועדפים כדי להשתמש בו בגרף.
רוצה להשתמש בסקריפ זה בגרף?
כתב ויתור
המידע והפרסומים אינם אמורים להיות, ואינם מהווים, עצות פיננסיות, השקעות, מסחר או סוגים אחרים של עצות או המלצות שסופקו או מאושרים על ידי TradingView. קרא עוד בתנאים וההגבלות.