OPEN-SOURCE SCRIPT
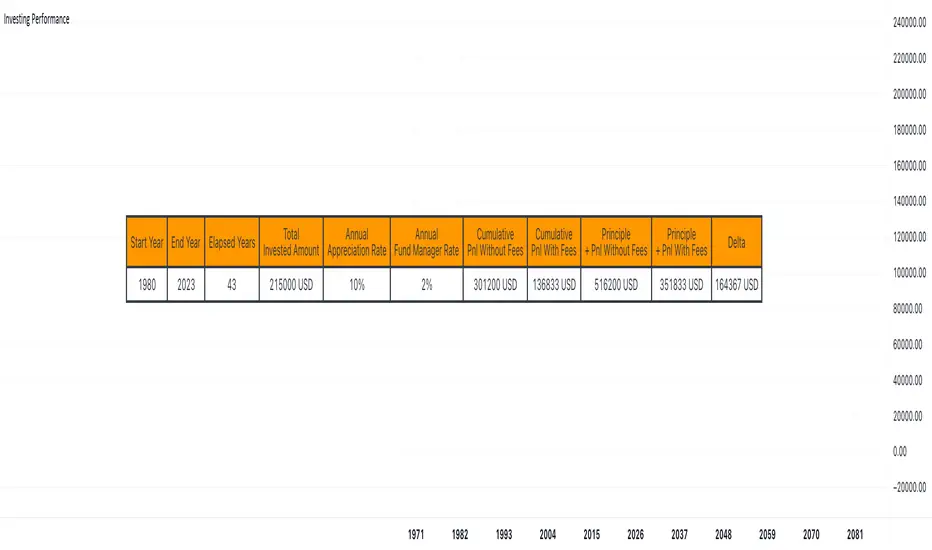
Investing Performance with vs without fees

Hello traders,
I had a chat with a friend recently who's using a fund manager services to invest for him in some US-based ETFs tracking the US indices.
I showed him using an online tool that those 2% annual fees he's paying to his fund manager are eating a lot of his profit overtime.
As I had some time, I decided to code this simulator in Pinescript because .... why not :)
RicardoSantos already did that Compound Interest function (tradingview.com/script/woq6TTda-FunctionCompoundInterest/)
I added the n parameter being the number of times the interest is compounded per unit of time
Compound interest is calculated using the following formula
CI = P*(1 + R/n) (n*t) – P
Here,
For now, the script only works on a yearly chart - I might update it later making it compatible with other chart timeframes - assuming there is some demand for it
If there is, let me know in the comments down below
All the best
Dave
I had a chat with a friend recently who's using a fund manager services to invest for him in some US-based ETFs tracking the US indices.
I showed him using an online tool that those 2% annual fees he's paying to his fund manager are eating a lot of his profit overtime.
As I had some time, I decided to code this simulator in Pinescript because .... why not :)
RicardoSantos already did that Compound Interest function (tradingview.com/script/woq6TTda-FunctionCompoundInterest/)
I added the n parameter being the number of times the interest is compounded per unit of time
Compound interest is calculated using the following formula
CI = P*(1 + R/n) (n*t) – P
Here,
- P is the principal amount.
- R is the annual interest rate.
- t is the time the money is invested or borrowed for.
- n is the number of times that interest is compounded per unit t, for example if interest is compounded monthly and t is in years then the value of n would be 12.
If interest is compounded quarterly and t is in years then the value of n would be 4.
For now, the script only works on a yearly chart - I might update it later making it compatible with other chart timeframes - assuming there is some demand for it
If there is, let me know in the comments down below
All the best
Dave
סקריפט קוד פתוח
ברוח האמיתית של TradingView, יוצר הסקריפט הזה הפך אותו לקוד פתוח, כך שסוחרים יוכלו לעיין בו ולאמת את פעולתו. כל הכבוד למחבר! אמנם ניתן להשתמש בו בחינם, אך זכור כי פרסום חוזר של הקוד כפוף ל־כללי הבית שלנו.
⭐️ I'm looking to sell Best Trading Indicator. DM me if interested
⭐️ Listed as an Official TradingView Trusted TOP Pine Programmer
📧 Coding/Consulting Inquiries: dave@best-trading-indicator.com
⏩ Course: best-trading-indicator.com
⭐️ Listed as an Official TradingView Trusted TOP Pine Programmer
📧 Coding/Consulting Inquiries: dave@best-trading-indicator.com
⏩ Course: best-trading-indicator.com
כתב ויתור
המידע והפרסומים אינם מיועדים להיות, ואינם מהווים, ייעוץ או המלצה פיננסית, השקעתית, מסחרית או מכל סוג אחר המסופקת או מאושרת על ידי TradingView. קרא עוד ב־תנאי השימוש.