OPEN-SOURCE SCRIPT
correlation
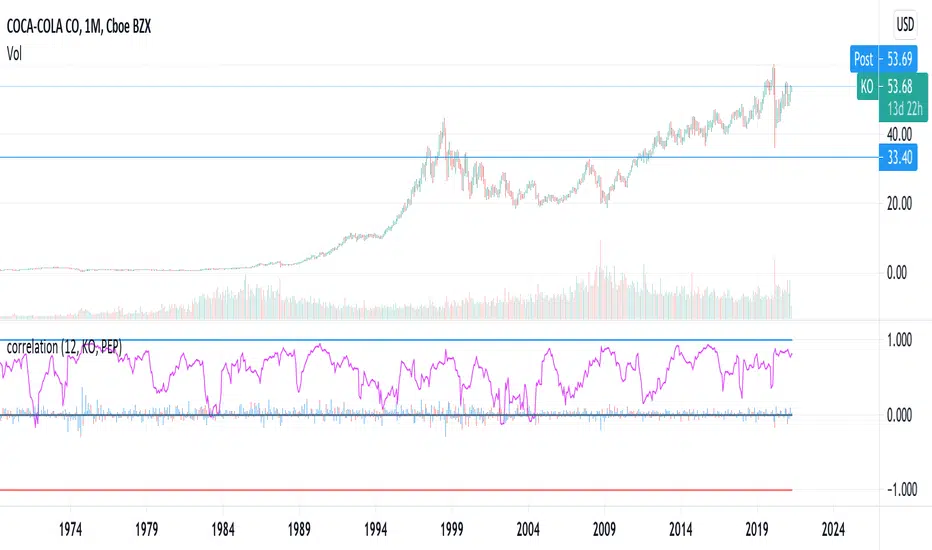
Choose two assets using the inputs, and plot their correlation. The correlation between their percentage returns is shown in purple, and the returns themselves are shown as small histograms.
By default, the correlation is computed over 12 periods, but you can adjust this as well using the inputs.
By default, the correlation is computed over 12 periods, but you can adjust this as well using the inputs.
סקריפט קוד פתוח
ברוח האמיתית של TradingView, יוצר הסקריפט הזה הפך אותו לקוד פתוח, כך שסוחרים יוכלו לעיין בו ולאמת את פעולתו. כל הכבוד למחבר! אמנם ניתן להשתמש בו בחינם, אך זכור כי פרסום חוזר של הקוד כפוף ל־כללי הבית שלנו.
כתב ויתור
המידע והפרסומים אינם מיועדים להיות, ואינם מהווים, ייעוץ או המלצה פיננסית, השקעתית, מסחרית או מכל סוג אחר המסופקת או מאושרת על ידי TradingView. קרא עוד ב־תנאי השימוש.