OPEN-SOURCE SCRIPT
Asset Selection Indicator by [VanHelsing]
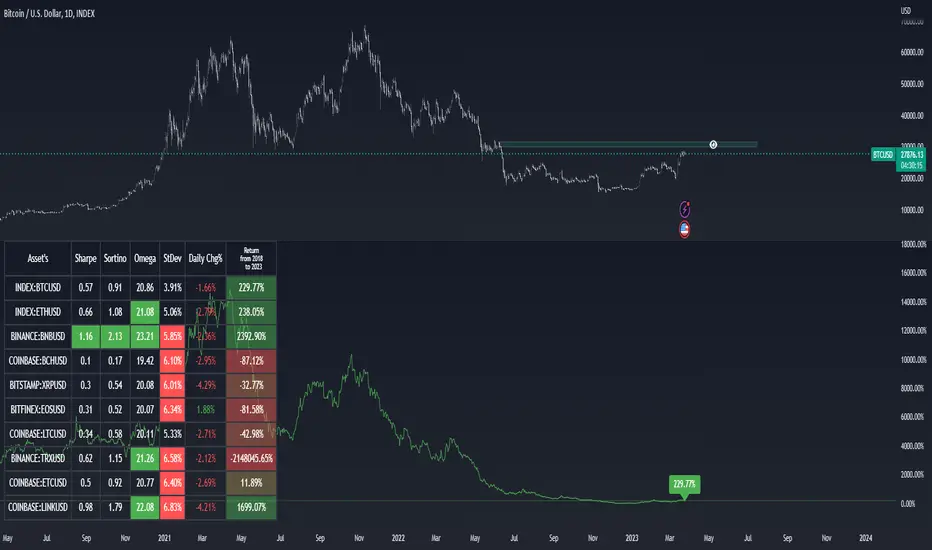
Asset Selection Indicator
This is a table what will help you to see what asset's are optimal to use in your portfolio or strategies.
By different metrics what are ploted on a table you will see how each individual asset performe compare to other
Sharpe, sortino, omega ratio's are very valueble metriscs in bulding portfolio and now you can easly see them without difficult calculations.
Do you want to know return of asset for 3, 5, 2 years? You are welcome to choose in settings whatever period you want, the same for other metrics
Below is instruction how to use this indicator:
(Explanation of Settings for a period of data)

(Asset selection by Sharpe, Omega, Sortino, StDev)

(How to plot Equity)

And a nice bonus is an alert!
(you can send it to a spreadsheet like I explained in other my indicator "Stock Correlation Table")

This is a table what will help you to see what asset's are optimal to use in your portfolio or strategies.
By different metrics what are ploted on a table you will see how each individual asset performe compare to other
Sharpe, sortino, omega ratio's are very valueble metriscs in bulding portfolio and now you can easly see them without difficult calculations.
Do you want to know return of asset for 3, 5, 2 years? You are welcome to choose in settings whatever period you want, the same for other metrics
Below is instruction how to use this indicator:
(Explanation of Settings for a period of data)
(Asset selection by Sharpe, Omega, Sortino, StDev)
(How to plot Equity)
And a nice bonus is an alert!
(you can send it to a spreadsheet like I explained in other my indicator "Stock Correlation Table")
סקריפט קוד פתוח
ברוח האמיתית של TradingView, יוצר הסקריפט הזה הפך אותו לקוד פתוח, כך שסוחרים יוכלו לעיין בו ולאמת את פעולתו. כל הכבוד למחבר! אמנם ניתן להשתמש בו בחינם, אך זכור כי פרסום חוזר של הקוד כפוף ל־כללי הבית שלנו.
כתב ויתור
המידע והפרסומים אינם מיועדים להיות, ואינם מהווים, ייעוץ או המלצה פיננסית, השקעתית, מסחרית או מכל סוג אחר המסופקת או מאושרת על ידי TradingView. קרא עוד ב־תנאי השימוש.