OPEN-SOURCE SCRIPT
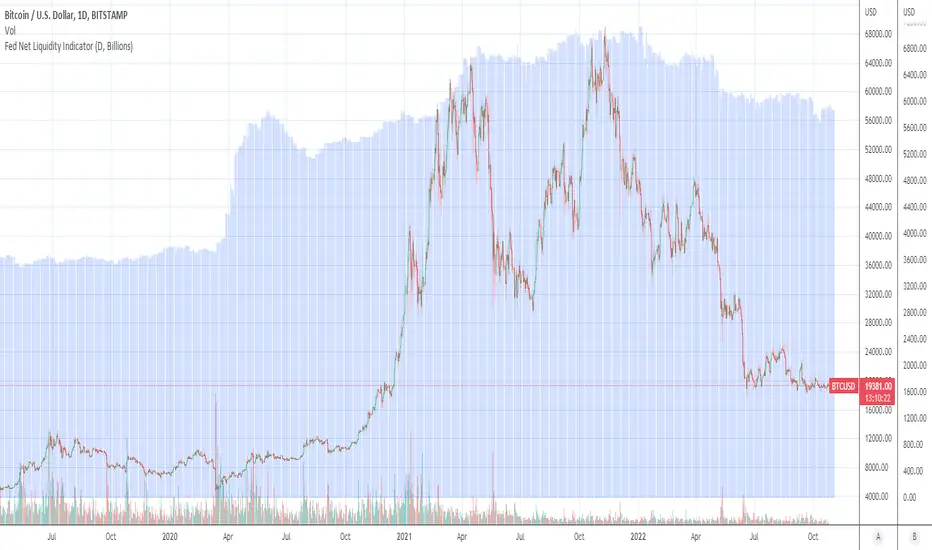
Fed Net Liquidity Indicator (24-Oct-2022 update)

This indicator is an implementation of the USD Liquidity Index originally proposed by Arthur Hayes based on the initial implementation of jlb05013, kudos to him!
I have incorporated subsequent additions (Standing Repo Facility and Central Bank Liquidity Swaps lines) and dealt with some recent changes in reporting units from TradingView.
This is a macro indicator that aims at tracking how much USD liquidity is available to chase financial assets:
- When the FED is expanding liquidity, financial asset prices tend to increase
- When the FED is contracting liquidity, financial asset prices tend to decrease
Here is the current calculation:
Net Liquidity =
(+) The Fed’s Balance Sheet (FRED:WALCL)
(-) NY Fed Total Amount of Accepted Reverse Repo Bids (FRED:RRPONTTLD)
(-) US Treasury General Account Balance Held at NY Fed (FRED:WTREGEN)
(+) NY Fed - Standing Repo Facility (FRED:RPONTSYD)
(+) NY Fed - Central Bank Liquidity Swaps (FRED:SWPT)
סקריפט קוד פתוח
ברוח האמיתית של TradingView, יוצר הסקריפט הזה הפך אותו לקוד פתוח, כך שסוחרים יוכלו לעיין בו ולאמת את פעולתו. כל הכבוד למחבר! אמנם ניתן להשתמש בו בחינם, אך זכור כי פרסום חוזר של הקוד כפוף ל־כללי הבית שלנו.
כתב ויתור
המידע והפרסומים אינם מיועדים להיות, ואינם מהווים, ייעוץ או המלצה פיננסית, השקעתית, מסחרית או מכל סוג אחר המסופקת או מאושרת על ידי TradingView. קרא עוד ב־תנאי השימוש.