OPEN-SOURCE SCRIPT
מעודכן Vortex Indicator With SMA
VI with SMA to determine the trend is solid.
VI+ cross over VI- with price over 20 SMA to confirm the trend.
Also, you can see the enhanced trend:
VI+ with the Letter H, with new high in the observe period.
VI- with the Letter L, with new high in the observe period.
Coding based on the original Vortex Indicator.
VI+ cross over VI- with price over 20 SMA to confirm the trend.
Also, you can see the enhanced trend:
VI+ with the Letter H, with new high in the observe period.
VI- with the Letter L, with new high in the observe period.
Coding based on the original Vortex Indicator.
הערות שחרור
Add Test VI+, VI- with uptrend STR (Sum of ATR)הערות שחרור
Check stocks SMA uptrend sequence with VIהערות שחרור
Uptrend SMA Seq. title.הערות שחרור
1: Modified the Background highlight factor:either use SMA or Donchain Channel mid line as Oscillator.
2: Fill the area between VI+ and VI - when the SMA uptrend Sequence is valid.
הערות שחרור
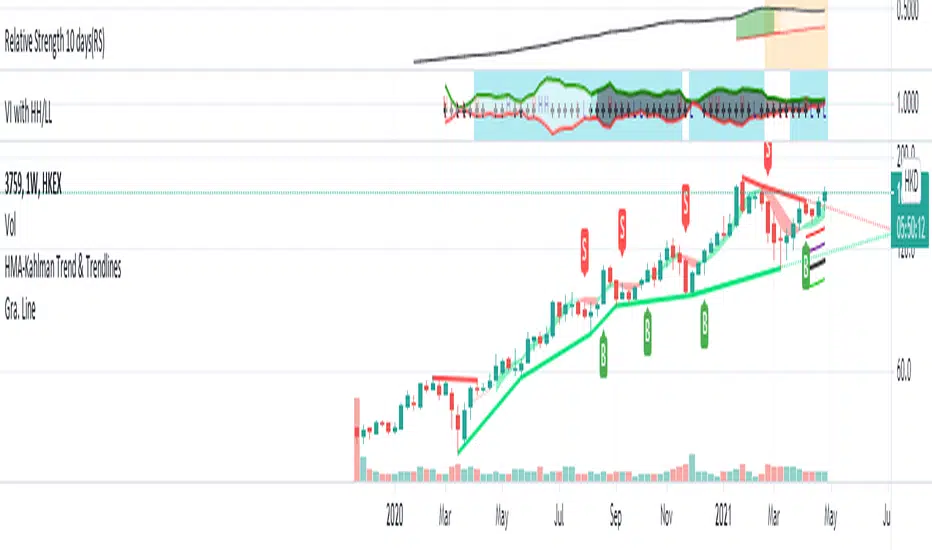
Traditionally, vortex indicator (VI) is an indicator composed of two lines : an uptrend line (VI+) : measure the price of the stock going up
a downtrend line (VI-) : measure the price of the stock going down
bleached areas within two VI lines is showing the "the fastEMA above slowEMA" of the stock.
eg. SMA10 > SMA40
"H" means that the VI+ > 5 days average VI+, which means stock price is move up relative to the price past 5 days average. ( simply is price action hgiher high)
"L" means that the VI- > 5 days average VI-, which means stock price decline relative to the price past 5 days average. ( simply is price action lower low)
In conclusion, I create this indicator help to easily knowing a stock is in uptrend and the momentum is maintain.
Two examples:
Look for Uptrend stock
1) the trading logic is looking for uptrend stocks (with blue background).
2) blue background where [VI+ is above VI- ] and [ stock price is above EMA or Donchain channel] .
3) "H" equal to [ VI+ is increase ] means the up-force is improving. "H" in red mean the price velocity is increase.
4) it is better hold the stock when the VI+ is keep move up. and be alert the "L" show up.
Look for Bottom UP/Breakout
1) when the background is in PINK, means [ VI- > VI+ ]. Stock is in downtrend.
2) waiting for the word "H" show up in frequent (several times), mean the stock price start have a high compare 5 days average.
3) wait for the crossover of the VI+ and VI- and the background to Blue.
סקריפט קוד פתוח
ברוח האמיתית של TradingView, יוצר הסקריפט הזה הפך אותו לקוד פתוח, כך שסוחרים יוכלו לעיין בו ולאמת את פעולתו. כל הכבוד למחבר! אמנם ניתן להשתמש בו בחינם, אך זכור כי פרסום חוזר של הקוד כפוף ל־כללי הבית שלנו.
כתב ויתור
המידע והפרסומים אינם מיועדים להיות, ואינם מהווים, ייעוץ או המלצה פיננסית, השקעתית, מסחרית או מכל סוג אחר המסופקת או מאושרת על ידי TradingView. קרא עוד ב־תנאי השימוש.