Kruegger

Bollinger Bands %B(RSI, Stoch) [Kru]

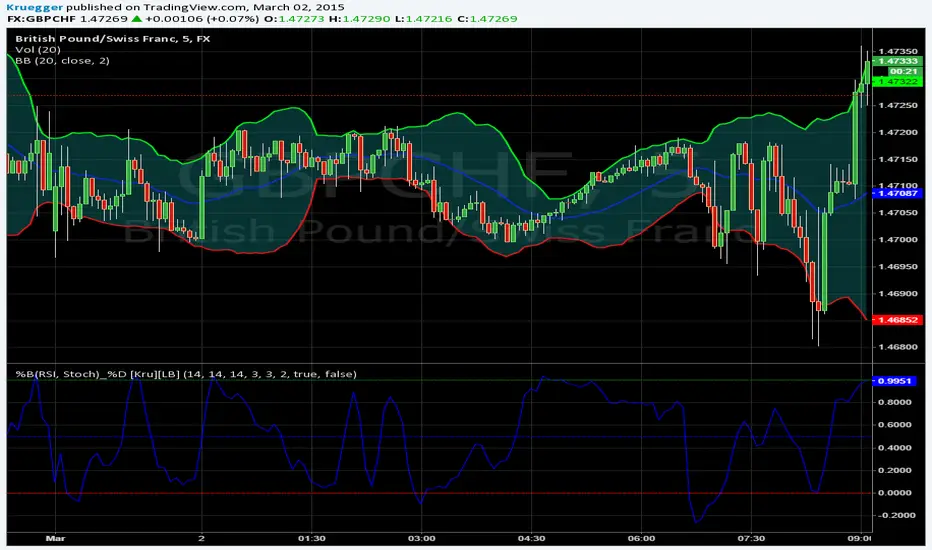
Calculate %B for RSI, Stoch, using Bollinger Bands algorithm.
סקריפט קוד פתוח

ברוח TradingView אמיתית, מחבר הסקריפט הזה פרסם אותו בקוד פתוח, כך שסוחרים יכולים להבין ולאמת אותו. כל הכבוד למחבר! אתה יכול להשתמש בו בחינם, אך שימוש חוזר בקוד זה בפרסום כפוף לכללי הבית. אתה יכול להכניס אותו למועדפים כדי להשתמש בו בגרף.

כתב ויתור

המידע והפרסומים אינם אמורים להיות, ואינם מהווים, עצות פיננסיות, השקעות, מסחר או סוגים אחרים של עצות או המלצות שסופקו או מאושרים על ידי TradingView. קרא עוד בתנאים וההגבלות.

רוצה להשתמש בסקריפ זה בגרף?
//
// @author Kruegger
//
// based on RSI/MFI with Bollinger Bands. Dynamic Oversold/Overbought levels, yayy! by @author LazyBear
// 
study(title = "RSI/Stoch %B Bolly bands by [Kruegger] based on [LazyBear]", shorttitle="%B(RSI, Stoch)_%D [Kru][LB]")
source = close
length_rsi = input(14, minval=1, title="RSI Length")
length_stoch = input(14, minval=1, title="Stoch Length")
lengthMA = input(14, minval=1, title="MA Length")
lengthD = input(3, minval=1, title="%D Length")
signal = input(3, minval=1, title="Signal smooth")

mult = input(2.0, minval=0.001, maxval=3, title="StDev Mult")
DrawRSI=input(true, title="Draw %B(RSI) ?", type=bool)
DrawStoch=input(false, title="Draw %B(Stoch) ?", type=bool)

// rsi
rsi_k = rsi(source, length_rsi)
rsi = sma(rsi_k,lengthD)
basis_rsi = sma(rsi, lengthMA)
dev_rsi = mult * stdev(rsi, length_rsi)
upper_rsi = basis_rsi + dev_rsi
lower_rsi = basis_rsi - dev_rsi
rsi_b = (rsi-lower_rsi) / (upper_rsi-lower_rsi)

// stoch
stoch_k = stoch(source, high, low, length_stoch)
stoch = sma(stoch_k,lengthD)
basis_stoch = sma(stoch, lengthMA)
dev_stoch = mult * stdev(stoch, length_stoch)
upper_stoch = basis_stoch + dev_stoch
lower_stoch = basis_stoch - dev_stoch
stoch_b = (stoch-lower_stoch) / (upper_stoch-lower_stoch)

// plot %b (RSI, Stoch)
plot(DrawRSI ? rsi_b:na, color=blue, linewidth=1, title="%B(RSI)")
plot(DrawStoch ? stoch_b:na, color=yellow, linewidth=1, title="%B(Stoch)")
//plot(DrawRSI ? rsi_b:na, color= (rsi_b > 0 and rsi_b[1] < 0)?blue:red, linewidth=1, title="%B(RSI)")

// Draw support line
h1 = hline(0.0, color=red, title="Lower Limit")
h2 = hline(1.0, color=green, title="Upper Limit")
h3 = hline(0.5, color=blue, title="Middle Limit")

//plotshape(rsi_b > 0 and rsi_b[1] < 0, color=lime, style=shape.triangleup, text="Buy", location=location.bottom)
//plotshape(falling(rsi_b[signal],signal), color=lime, style=shape.triangleup, text="Buy", location=location.bottom)
//plotshape(rsi_b < rsi_b[signal] and rsi_b[signal] >= rsi_b[signal-1], color=red, style=shape.triangledown, text="Sell", location=location.top)