PROTECTED SOURCE SCRIPT
מעודכן Moving pivot: Wonton

Protected.
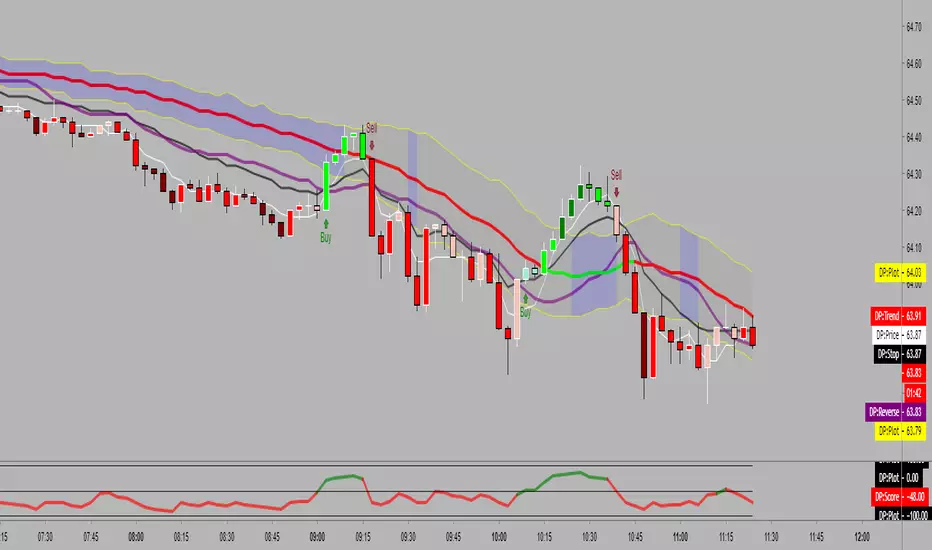
Price action analysis.
Gray = No signal, do nothing
Blue = Exit Position (may just move from buy to sell and skip this depending on price action)
Green= Buy
Lime (brighter) = Strong Buy
Maroon= Sell
Red (brighter) = Strong Sell
The Price Action Balance line or the Long Term Trend line (yellow) can either be used for stop/reversal placement, triggered on close.
הערות שחרור
Added Stochastic Lock indicator.הערות שחרור
Updated some functions and decision matrix.Trend line also more visible, was Yellow, is now Navy
הערות שחרור
fix.הערות שחרור
Added ability to see debug lines - for whatever reason.הערות שחרור
Updated algo.הערות שחרור
Updated.Ability to flag stochastic extremes (settings).
Numerical score on the bar showing strength of the signal.
Scores are 20% for 20% or lower. 90% for 90% or better and levels in between.
- it is possible to use this to stagger your trades in and out of a position.
- some key line markers are included to help place stops and look for reversals
- depending on your risk tolerance, the red line is a tight stop, the purple is looser
No Buy or Sell flag will post inside the long term trend band, those tend to be chop zones, but you want to catch the break out of that zone so bar colors and scores will display.
Shorter time frames are better at capturing price action without giving up too much on larger changes in longer time frames. All depends on your trading style.
Added longer term trend indicator to follow visually.
Please like or comment if you have feedback.
הערות שחרור
Updated criteria and added a few options for flags.Recommend leaving the stochastic boost at 4. I may remove this as editable pending feedback.
הערות שחרור
Further tuning based on feedback.סקריפט מוגן
סקריפט זה פורסם כמקור סגור. עם זאת, תוכל להשתמש בו בחופשיות וללא כל מגבלות – למד עוד כאן
כתב ויתור
המידע והפרסומים אינם מיועדים להיות, ואינם מהווים, ייעוץ או המלצה פיננסית, השקעתית, מסחרית או מכל סוג אחר המסופקת או מאושרת על ידי TradingView. קרא עוד ב־תנאי השימוש.
סקריפט מוגן
סקריפט זה פורסם כמקור סגור. עם זאת, תוכל להשתמש בו בחופשיות וללא כל מגבלות – למד עוד כאן
כתב ויתור
המידע והפרסומים אינם מיועדים להיות, ואינם מהווים, ייעוץ או המלצה פיננסית, השקעתית, מסחרית או מכל סוג אחר המסופקת או מאושרת על ידי TradingView. קרא עוד ב־תנאי השימוש.