OPEN-SOURCE SCRIPT
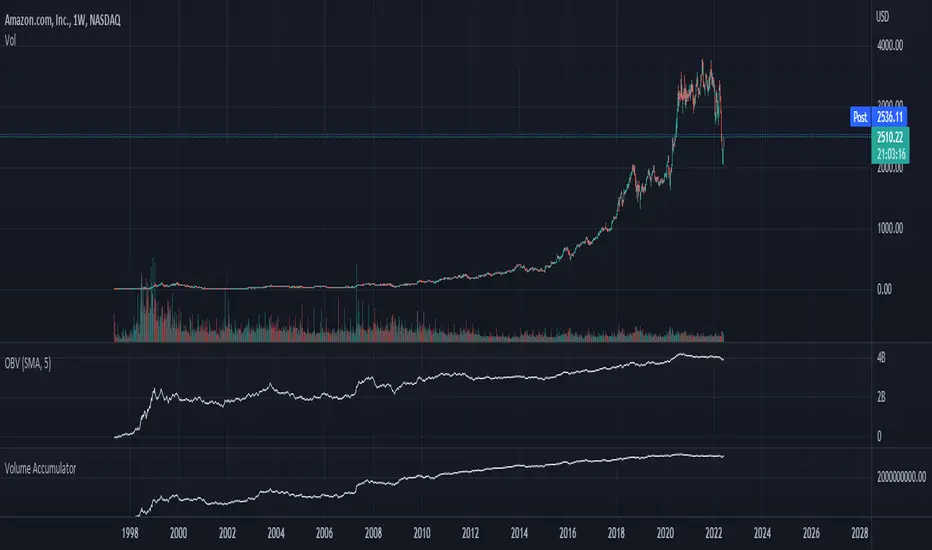
Chaikin Volume Accumulator

The Volume Accumulator is used in technical analysis to identify strengths and weaknesses in a market. It is derived from the On Balance Volume indicator, except that instead of giving all the volume to bears on red days and bulls on green days it gives a proportional amount to both depending on the relative close price. As with many trading indicators, classic divergence between the VA and the close price may indicate an incoming reversal.
As a general rule of thumb:
Price Up:
VA up = clear uptrend
VA sideways = moderate uptrend
VA down = weak uptrend
Price Sideways:
VA up = accumulation
VA sideways = no bias
VA down = distribution
Price Down
VA up = weak downtrend
VA sideways = moderate downtrend
VA down = strong downtrend
As a general rule of thumb:
Price Up:
VA up = clear uptrend
VA sideways = moderate uptrend
VA down = weak uptrend
Price Sideways:
VA up = accumulation
VA sideways = no bias
VA down = distribution
Price Down
VA up = weak downtrend
VA sideways = moderate downtrend
VA down = strong downtrend
סקריפט קוד פתוח
ברוח האמיתית של TradingView, יוצר הסקריפט הזה הפך אותו לקוד פתוח, כך שסוחרים יוכלו לעיין בו ולאמת את פעולתו. כל הכבוד למחבר! אמנם ניתן להשתמש בו בחינם, אך זכור כי פרסום חוזר של הקוד כפוף ל־כללי הבית שלנו.
כתב ויתור
המידע והפרסומים אינם מיועדים להיות, ואינם מהווים, ייעוץ או המלצה פיננסית, השקעתית, מסחרית או מכל סוג אחר המסופקת או מאושרת על ידי TradingView. קרא עוד ב־תנאי השימוש.