OPEN-SOURCE SCRIPT
Price Variation Percent (PVP)
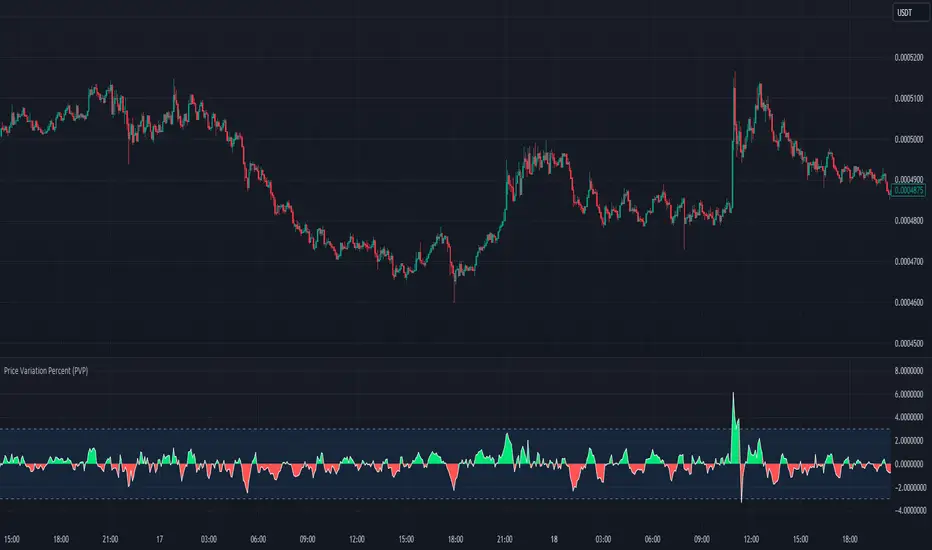
This indicator shows the percentage of price variation, depending on the length of bars that the user chooses.
At a glance you can see if the price jumps in volatility and how often it does so. Very useful for scalping.
The upper and lower bands are limits of price variation in percentage, therefore when there is a crossing above or below you can immediately see how volatile the asset is and between what percentages of change it is moving.
סקריפט קוד פתוח
ברוח האמיתית של TradingView, יוצר הסקריפט הזה הפך אותו לקוד פתוח, כך שסוחרים יוכלו לעיין בו ולאמת את פעולתו. כל הכבוד למחבר! אמנם ניתן להשתמש בו בחינם, אך זכור כי פרסום חוזר של הקוד כפוף ל־כללי הבית שלנו.
כתב ויתור
המידע והפרסומים אינם מיועדים להיות, ואינם מהווים, ייעוץ או המלצה פיננסית, השקעתית, מסחרית או מכל סוג אחר המסופקת או מאושרת על ידי TradingView. קרא עוד ב־תנאי השימוש.