OPEN-SOURCE SCRIPT
Function 2 Point Line using UNIX TIMESTAMP V1
experimental:
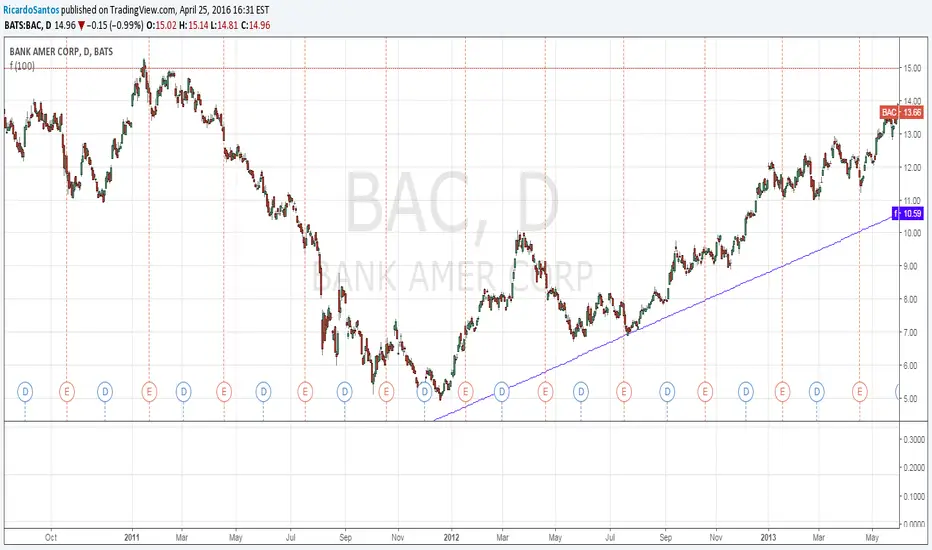
draws a line from 2 vectors(price, time)
update:
reformatted the function,
added automatic detection of the period multiplier by approximation(gets a bit goofy with stocks/week time),
example using timestamp() function.
offsetting is still bugged, i cant find a way around it atm.
draws a line from 2 vectors(price, time)
update:
reformatted the function,
added automatic detection of the period multiplier by approximation(gets a bit goofy with stocks/week time),
example using timestamp() function.
offsetting is still bugged, i cant find a way around it atm.
סקריפט קוד פתוח
ברוח האמיתית של TradingView, יוצר הסקריפט הזה הפך אותו לקוד פתוח, כך שסוחרים יוכלו לעיין בו ולאמת את פעולתו. כל הכבוד למחבר! אמנם ניתן להשתמש בו בחינם, אך זכור כי פרסום חוזר של הקוד כפוף ל־כללי הבית שלנו.
כתב ויתור
המידע והפרסומים אינם מיועדים להיות, ואינם מהווים, ייעוץ או המלצה פיננסית, השקעתית, מסחרית או מכל סוג אחר המסופקת או מאושרת על ידי TradingView. קרא עוד ב־תנאי השימוש.