OPEN-SOURCE SCRIPT
Roc & Atr
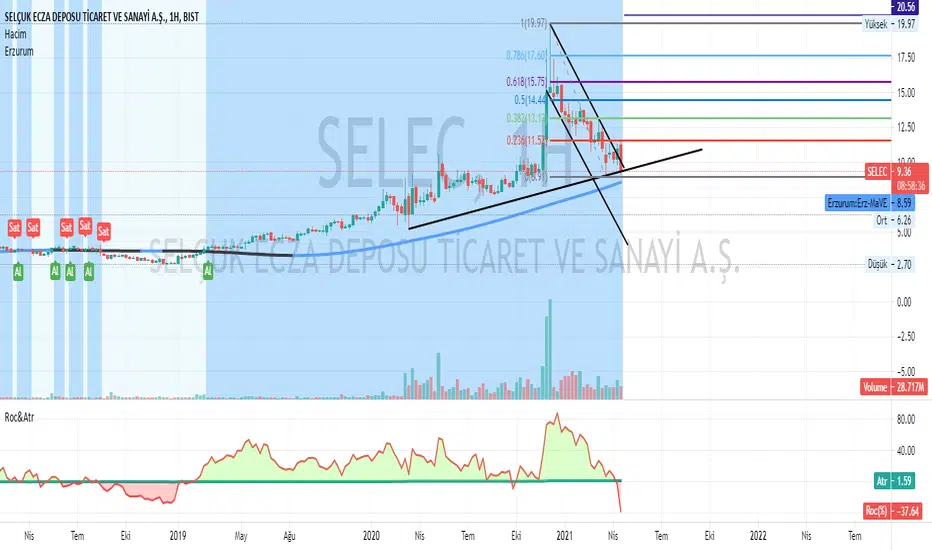
Roc & Atr Orders
My indicator, where I compare the 20 bar change percentage with the 14 bar atr band, I hope it will be useful to everyone. the green zones can be interpreted as BUY and the red zone as SELL zone. In graphs with high motion and low atr, the channel narrowing can be interpreted as BUY and the channel opening as SELL.
No indicator shows you the right way ... The best way is your own thoughts
סקריפט קוד פתוח
ברוח TradingView אמיתית, מחבר הסקריפט הזה פרסם אותו בקוד פתוח, כך שסוחרים יוכלו להבין ולאמת אותו. כל הכבוד למחבר! אתה יכול להשתמש בו בחינם, אבל השימוש החוזר בקוד זה בפרסום כפוף לכללי הבית. אתה יכול להכניס אותו למועדפים כדי להשתמש בו בגרף.
כתב ויתור
המידע והפרסומים אינם אמורים להיות, ואינם מהווים, עצות פיננסיות, השקעות, מסחר או סוגים אחרים של עצות או המלצות שסופקו או מאושרים על ידי TradingView. קרא עוד בתנאים וההגבלות.