Not really a CVDThis is not really a CVD, more like an experiment.
Because we don't have access to bid or ask volume for BTCUSD/XBTUSD, we can't really make a CVD.
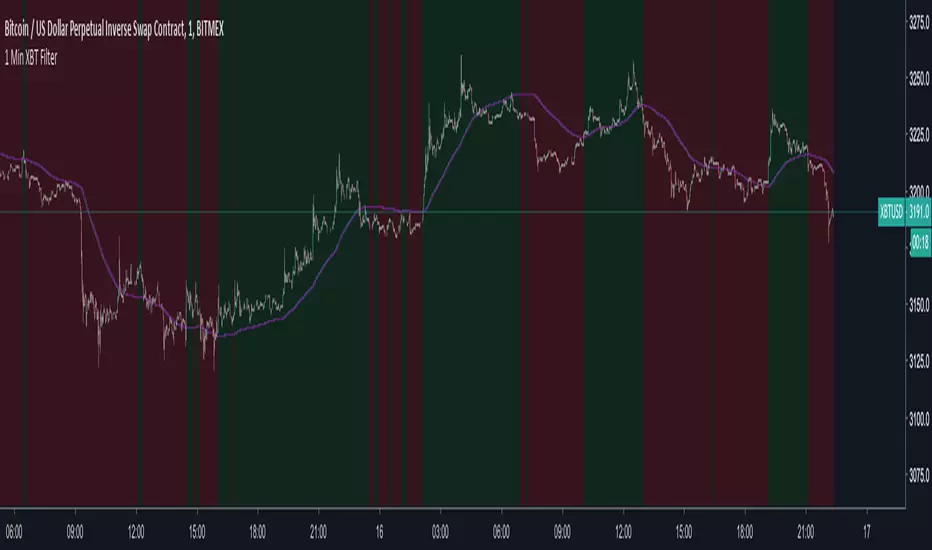
So this one instead is based on the 1 min timeframe. When the 1 min candle is up/green, the volume is positive, but when the candle is down/red, the volume is negative.
An other point is that the "security" function used in the script have an approx max history of 137 days for the 1 min timeframe.
This script is very simple but if you have any questions, feel free to ask.
אינדיקטור Pine Script®