Month of Year Performance█ OVERVIEW
The Month of Year Performance indicator is designed to visualize and compare the cumulative percentage change for each month of the year. By aggregating monthly returns, it helps uncover seasonal trends and potential anomalies in financial markets.
In financial analysis, a calendar based anomaly refers to recurring patterns or tendencies associated with specific time periods, such as days of the week. By calculating the cumulative percentage change for each month (January through December) and displaying the results both graphically and in a summary table, this indicator helps identify whether certain months
consistently outperform others.
█ FEATURES
Customisable time window via Time Settings.
Calculates cumulative percentage change for each month (January to December) separately.
Built-in error check to ensure the indicator is applied on a Monthly timeframe.
Distinct visual representation for each month using unique colours.
Customisable table settings including location and font size.
Displays a performance summary table with metrics such as performance, average return, % positive, and count.
█ HOW TO USE
Add the indicator to a chart set to a Monthly timeframe.
Select your desired Start Time and End Time in the Time Settings.
Toggle the performance table on or off in the Table Settings.
Adjust the table’s location and font size as needed.
View the cumulative monthly performance plotted in distinct colours.
Colour Scheme:
January: Blue
February: Red
March: Green
April: Orange
May: Purple
June: Fuchsia
July: Teal
August: Yellow
September: Navy
October: Lime
November: Maroon
December: Aqua
Cummulative

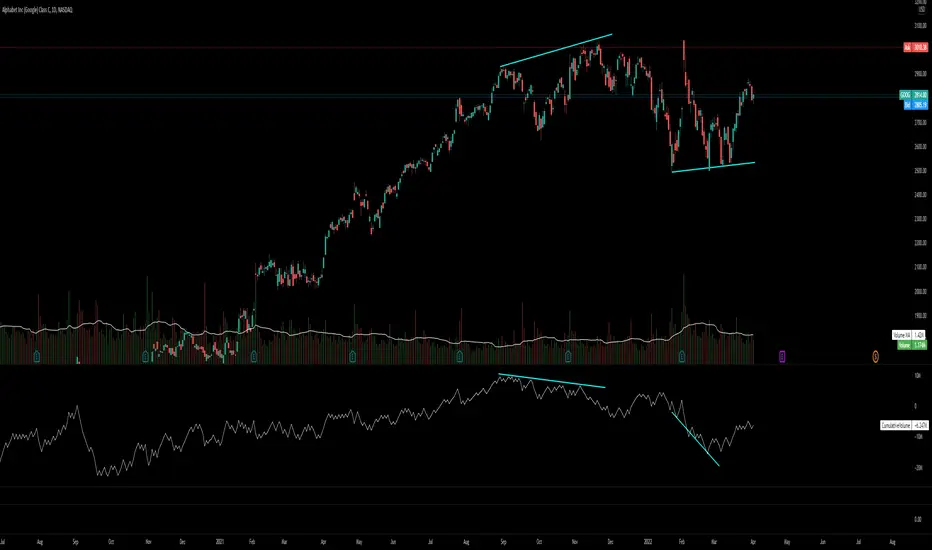
Cumulative VolumeThis is a simple script and is derived from OBV (On Balance Volume).
While OBV will smoothen the data, Cumulative Volume will start at zero and add the trading volume on a bullish day and will subtract on a bearish day.
This tool is great to spot divergences between price and volume.
Enjoy! ;-)