Twiggs-ss The modified indicator money flow Chaikin -LasyBear. Drastically accumulation and a sharp distribution of the painted colorאינדיקטור Pine Script®מאת swetswet128
Grant's PSAR SignalOpen and close signals for long positions on XJO.אסטרטגיית Pine Script®מאת GrantPeace77618
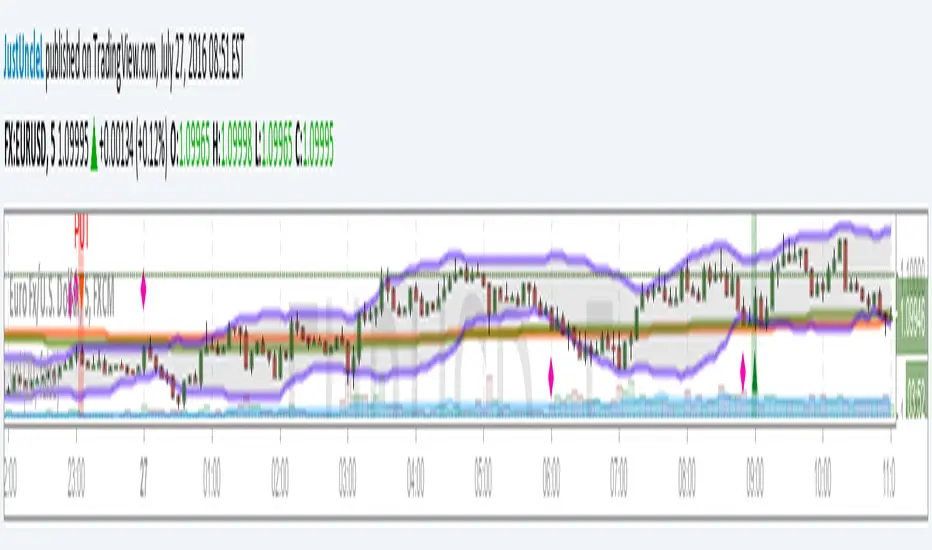
Bollinger Band and Moving Average v0.1 by JustUncleLThis is another Bollinger Band strategy+indicator in my series of Bollinger based setups. This one is seems to work best with 5min charts and 20 to 30min expiry. The strategy follows variation of a Bollinger band + Moving Averages reversal strategy, it uses the 2 moving averages mainly to determine market direction. אינדיקטור Pine Script®מאת JustUncleL22362
2% candlePart of my strategy involves entering a trade based on a candle on a 5-min chart being < 2% (ignoring major volatility). I got tired of calculating the range of a single candle either in my head or on a calculator, so I wrote this up. Feel free to share it. Shows the %move of any single candle, default horizontal lines are 1% & 2%, can be changed by clicking the gear icon next to the indicator after you have added the indicator to your chart. Works on any timeframe, 5m, 1h, 1d, etc , obviously the higher the timeframe, the larger the move.אינדיקטור Pine Script®מאת MattDeLong44283
Ichimoku PanOptic TM-V1Modified Ichimoku indicator with signals from PanOptic Method by User Ichimoku_Trader.אינדיקטור Pine Script®מאת BrainZZ648
Daily PivotsAn indicator to show the daily pivots in chart <= to 24 hoursאינדיקטור Pine Script®מאת Tass11767
Should I FOMO??Should I FOMO?? (number of revisited candles in a timeframe) ============================================================= idea: hecate I fomo way too much so i have created this little indicator to show me how many times (PERCENT) a candle is revisited in a period P with the idea that i should not panic and maybe just wait patiently for a better price. Just set the period P to your desired timeframe, days hours, whatever and WAIT patiently because many times it does come back :D and many times !! אינדיקטור Pine Script®מאת hecate55124
MaxWarren's Pine Acceleration - 2nd DerivativeThis is the acceleration of a chart written in pine. It's the second derivative otherwise the derivative of the momentum. It shows how fast a stock's momentum is changing and in what direction. As standard I left the controls in the settings for source and length of the estimate. I will be incorporating this in other more complicated scripts here shortlyאינדיקטור Pine Script®מאת UnknownUnicorn18726622192
MaxW Pine MomentumMomentum written in Pine You are able to change the source with this.אינדיקטור Pine Script®מאת UnknownUnicorn18726665
Intraday TS ,BB + Buy/Sell +Squeeze Mom.+ adx-dmiIntraday 5+ min indicator/strategy. Mix of indicator as BB, Ema , Roc , adx/dmi with buy and TP/SL point. All in 1 indicator easy to use . Just look the color chnge and the shape add the the barsאינדיקטור Pine Script®מאת MarcoValente3939 5.1 K
Jinqian168_V2RSI, EMA of RSI, EMA of RSI's EMA, and Stochastic. V2 added Price Bar Coloring. Buy when Orange or Green, Sell when Yellow or Red.אינדיקטור Pine Script®מאת jinqian1682276
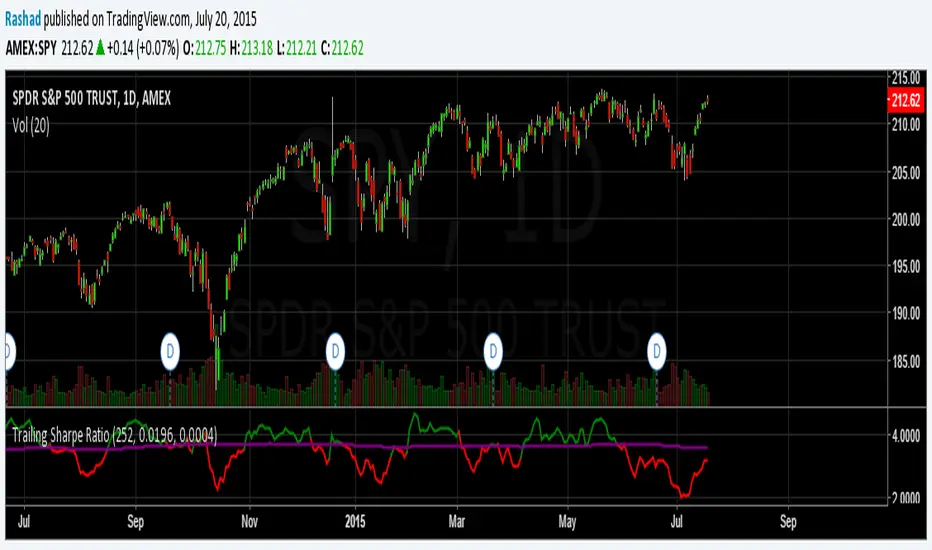
Trailing Sharpe RatioThe Sharpe ratio allows you to see whether or not an investment has historically provided a return appropriate to its risk level. A Sharpe ratio above one is acceptable, above 2 is good, and above 3 is excellent. A Sharpe ratio less than one would indicate that an investment has not returned a high enough return to justify the risk of holding it. Interesting in this example, SPY's one year avg Sharpe ratio is above 3. This would mean on average SPY returns 3x better returns than the risk associated with holding it, implying there is some sort of underlying value to the investment. When the sharpe ratio is above its signal, this implies the investment is currently outperforming compared to its typical return, below the signal means the investment is currently under performing. A negative Shape would mean that the investment has not provided a positive return, and may be a possible short candidate. אינדיקטור Pine Script®מאת Rashad99773
DecisionPoint Volume Swenlin Trading Oscillator [LazyBear]This is the volume version of "DecisionPoint Breadth Swenlin Trading Oscillator" DecisionPoint Swenlin Trading Oscillator can be used to identify short-term tops and bottoms. You can read about the interpretation of the signals (& gotchas) in the link below. I have added support for NYSE / NASD / AMEX and also a combined mode. You can specify custom advancing/declining volume symbols too. More Info: DBSTO: Article: stockcharts.com List of my public indicators: bit.ly List of my app-store indicators: blog.tradingview.com Having both Swenlin Breadth and Volume oscillators help spot the divergences quickly: אינדיקטור Pine Script®מאת LazyBear2222 9.6 K
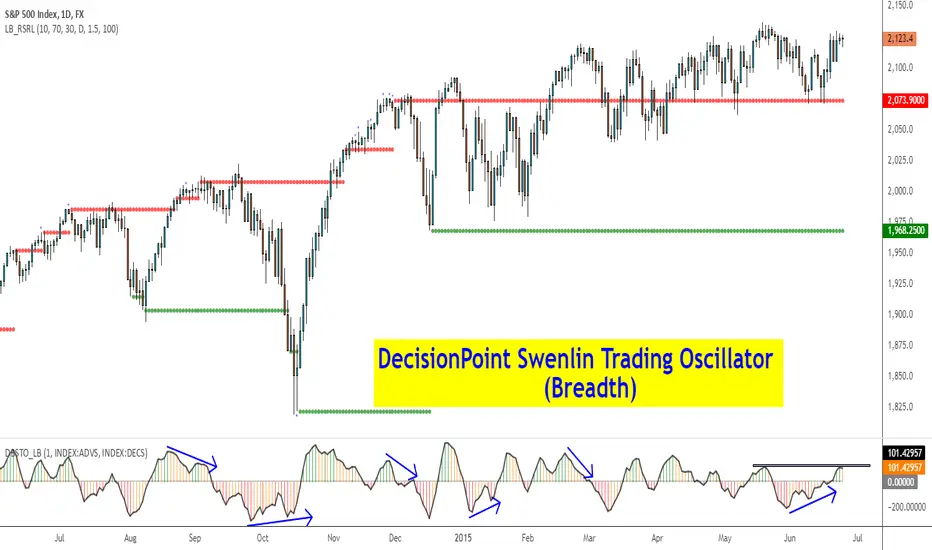
DecisionPoint Breadth Swenlin Trading Oscillator [LazyBear]DecisionPoint Swenlin Trading Oscillator can be used to identify short-term tops and bottoms. This is a breadth indicator. STO is designed to be calculated using either issues or volume, I will post a follow up indicator that makes use of volume. You can read about the interpretation of the signals (& gotchas) in the link below. I have added support for NYSE / NASD / AMEX and also a combined mode. You can specify custom advancing/declining mkt symbols too. More Info: stockcharts.com List of my public indicators: bit.ly List of my app-store indicators: blog.tradingview.com אינדיקטור Pine Script®מאת LazyBear1010 2.8 K
DecisionPoint Price Momentum Oscillator [LazyBear]The DecisionPoint Price Momentum Oscillator (PMO) is an oscillator based on a Rate of Change calculation that is smoothed twice with custom exponential moving averages. Because the PMO is normalized, it can also be used as a relative strength tool. PMO can be used in many ways: - PMO can be used to determine the OB/OS state. While the +2.5 to -2.5 is the usual range for broad stock market indexes, each price index will have its own “signature” range. You may have to tune this for your instrument. - PMO triggers buy/sell on signal crossovers and ZERO crossovers. - Common patterns like BullKiss, BearKiss are useful to track. See the link below for more info. - Divergences. - Histo-only mode that can be used similar to MACD-Histo. I have exposed all params as configurable. Have fun tuning :) Don't forget to share what you found for your instrument. More Info: stockcharts.com List of my public indicators: bit.ly List of my app-store indicators: blog.tradingview.com Some Sample Charts: TWTR: MSFT: GOOGL: אינדיקטור Pine Script®מאת LazyBear4747 9.1 K
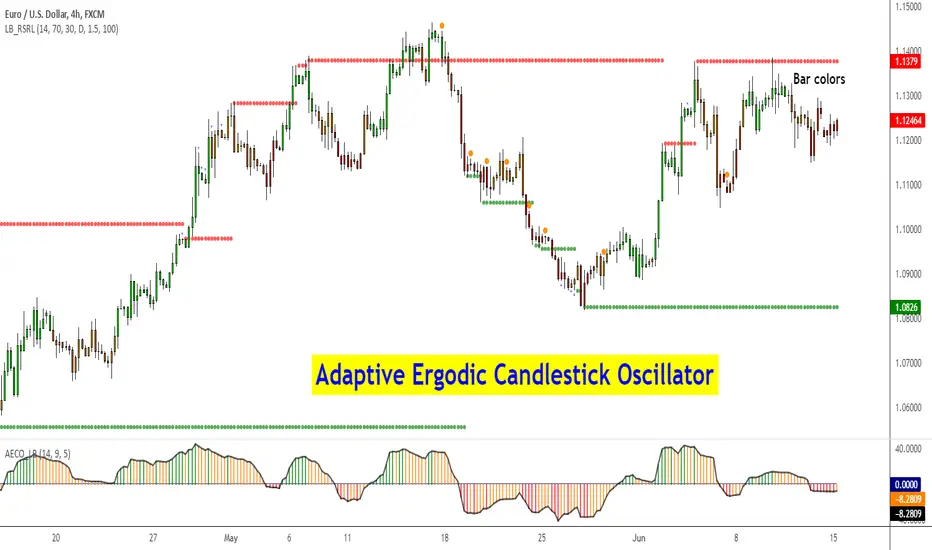
Adaptive Ergodic Candlestick Oscillator [LazyBear]This updates Blau's excellent Candlestick oscillator to be adaptive by using the length of a scaled stochastic indicator and an exponent (for calculating the smoothing coefficient) to obtain the moving average. Check out the options page for configurable variables. More info on Ergodic Oscillator: Book: "Momentum, Direction and Divergence" by William Blau List of my public indicators: bit.ly List of my app-store indicators: blog.tradingview.com אינדיקטור Pine Script®מאת LazyBear1313 2.5 K
Apirine Slow RSI [LazyBear]The slow relative strength index (SRSI) indicator created by Vitali Apirine is a momentum price oscillator similar to RSI in its application and interpretation. Oscillating between 0 and 100, it generates both OB/OS signals and midline (50) cross over signals and divergences. As author suggests, bullish/bearish divergences generated by SRSI are not as effective during strong trends. To avoid fading an established trend, the system is used in conjunction with a trend confirmation tool like ADX indicator. You can configure the OB/OS levels, default are 70/30. More info: The slow relative strength index, TASC 2015-07 List of my public indicators: bit.ly List of my app-store indicators: blog.tradingview.com אינדיקטור Pine Script®מאת LazyBear77 2.4 K
Ehlers Smoothed Adaptive Momentum [LazyBear]Bored of Ehlers yet? :) I still have plenty of Ehlers in my collection, was thinking of publishing one of his Fishers or Adaptive RVI next, but @ChartArt requested Smoothed Adaptive Momentum (SAM), so here we go... This is my 200th script (not including the variations and other custom scripts I shared over PM). My complete list of indicators here - bit.ly Now, about the indicator :) This smoothed adaptive momentum is straightforward to use (per Ehlers original rules). If it crosses above zero buy the next open, if it crosses below zero sell the next open. Of course, I strongly suggest filtering the signals. Finally, here's an Ehlers-only chart to help determine where BTC is heading :P More info: - Ehlers CG Oscillator: - Cybernetic Analysis for Stocks and Futures (Ehlers) List of my public indicators: bit.ly List of my app-store indicators: blog.tradingview.com --Updated chart-- Here's the chart with barcolors ON (forgot to turn it on in the published one) אינדיקטור Pine Script®מאת LazyBear77 2.5 K
Ehlers Adaptive CG Indicator [LazyBear]Lets go with another adaptive indicator today. BTW, this is my 199th script (1 more and I am planning to work on my other backlogs). This is the adaptive version of Ehlers' Center Of Gravity (CG) (already published, check "More info" below). Idea behind making something "adaptive" is to calculate it using dynamic cycle period inputs instead of static setting. In adaptive CG, Ehlers uses the dominant cycle period as the length in computation of alpha. According to Ehlers this should be more responsive than the non-adaptive version. Buy and sell signals should often occur one bar earlier than for the non-adaptive version. I have the usual options in place. Check out plain CC for comparison. Here's a quick comparison between CG and Adaptive CG: More info: - Ehlers CG Oscillator: - Cybernetic Analysis for Stocks and Futures (Ehlers) List of my public indicators: bit.ly List of my app-store indicators: blog.tradingview.com אינדיקטור Pine Script®מאת LazyBear22 1.8 K
Ehlers Adaptive Cyber Cycle Indicator [LazyBear]Another famous Ehlers indicator. This is the adaptive version of Ehlers' Cyber Cycle (CC) (already published, check "More info" below). Idea behind making something "adaptive" is to calculate it using dynamic cycle period inputs instead of static setting. In adaptive cyber cycle, Ehlers uses the dominant cycle period as the length in computation of alpha. According to Ehlers this should be more responsive than the non-adaptive version. Buy and sell signals should often occur one bar earlier than for the non-adaptive version. I have the usual options in place. Check out plain CC for comparison. More info: - Cyber Cycle Indicator: - Cybernetic Analysis for Stocks and Futures (Ehlers) List of my public indicators: bit.ly List of my app-store indicators: blog.tradingview.com אינדיקטור Pine Script®מאת LazyBear1313 1.8 K
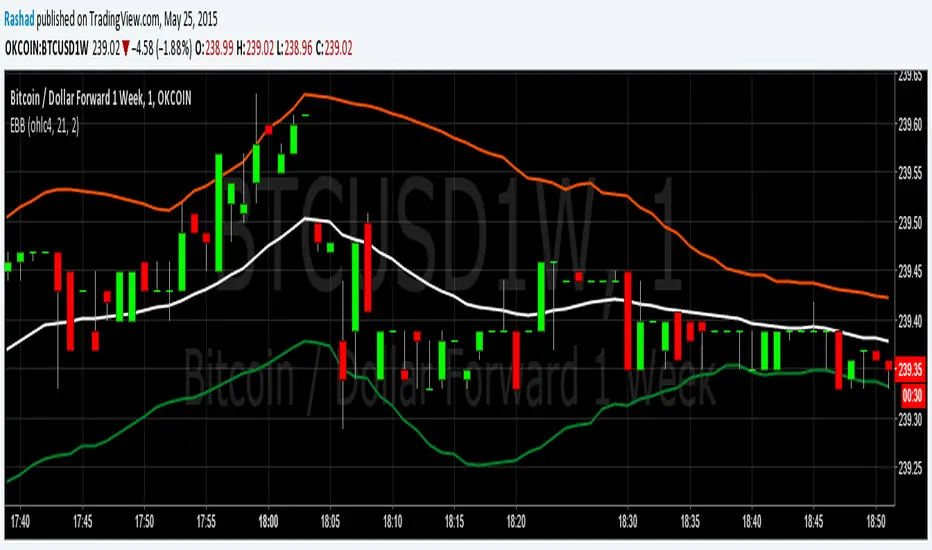
Exponential Bollinger BandsThese Bollinger Bands are exponential because the variance is calculated using the exponential moving average, rather than just adding the normal standard deviation to the ema. This may be more useful because the exponential standard deviation should be more sensitive to near term increases or decreases in volatility. Please do not forget that Bollinger Bands should always be combined with another method of analysis. Bollinger Bands just provide an easy way to gauge where the price could range in. At 2 standard deviations of a continuously random variable, more than 98% of data points are in this range. I am however going to test this in excel to get the average number of data points that stay in the range for Bitcoin. I will upload my findings when I complete that. Please monitor this description if your interested.אינדיקטור Pine Script®מאת Rashad99 1.7 K
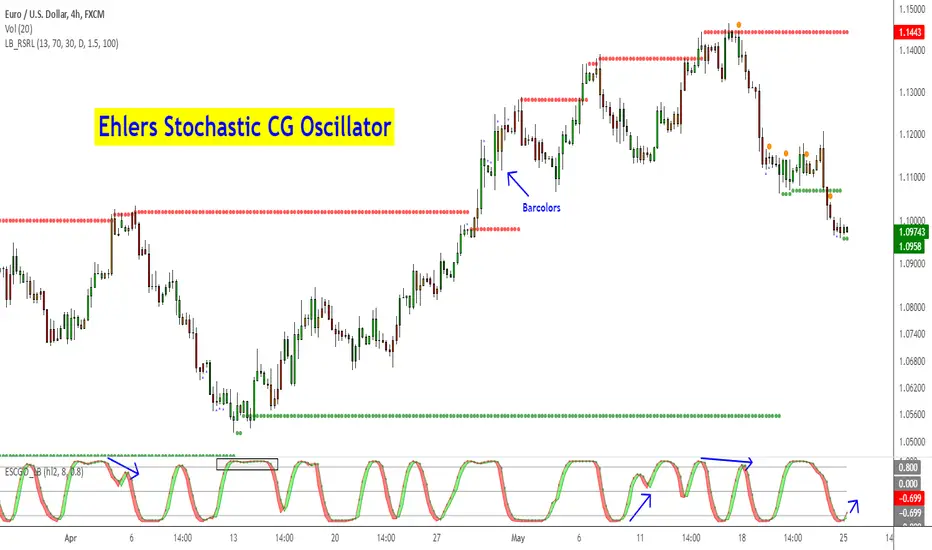
Ehlers Stochastic CG Oscillator [LazyBear]Another one from Ehlers. Ehlers likes the idea behind StochRSI so much, he dedicated a full chapter in his book (linked below) on how stoch works with his "superlative" (his words, not mine) indicators. This is stoch of his CG oscillator. Standard stochastic oscillator uses fixed period for calculations and does not adjust to the constantly changing market cycle length. Stochastic CG Oscillator does not have such a drawback. Use this like normal stochRSI osc (Uncheck "Fill Osc/Trigger" option, sample chart below) More info: - CG oscillator: - Cybernetic Analysis for Stocks and Futures (Ehlers) List of my public indicators: bit.ly List of my app-store indicators: blog.tradingview.com אינדיקטור Pine Script®מאת LazyBear88 5.1 K
Ehlers MESA Adaptive Moving Average [LazyBear]Another one to add to Ehlers collection. The MESA Adaptive Moving Average (MAMA) adapts to price movement based on the rate of change of phase as measured by the Hilbert Transform Discriminator. This method features a fast attack average and a slow decay average so that composite average rapidly ratchets behind price changes and holds the average value until the next ratchet occurs. Consider FAMA (Following AMA) as the signal. Here are some of the options: Fill MAMA/FAMA region (ribbon mode): Mark Crossovers: The above options (along with the bar colors) allow this to be used as a standalone system. BTW, John Ehlers calls MAMA, "Mother of all Adaptive Moving Averages", lemme know what you think :) More info: - MESA Adaptive Moving Average, Stocks and Commodities Magazine, August 2001 - MAMA: www.mesasoftware.com List of my public indicators: bit.ly List of my app-store indicators: blog.tradingview.com אינדיקטור Pine Script®מאת LazyBear4747 6.1 K