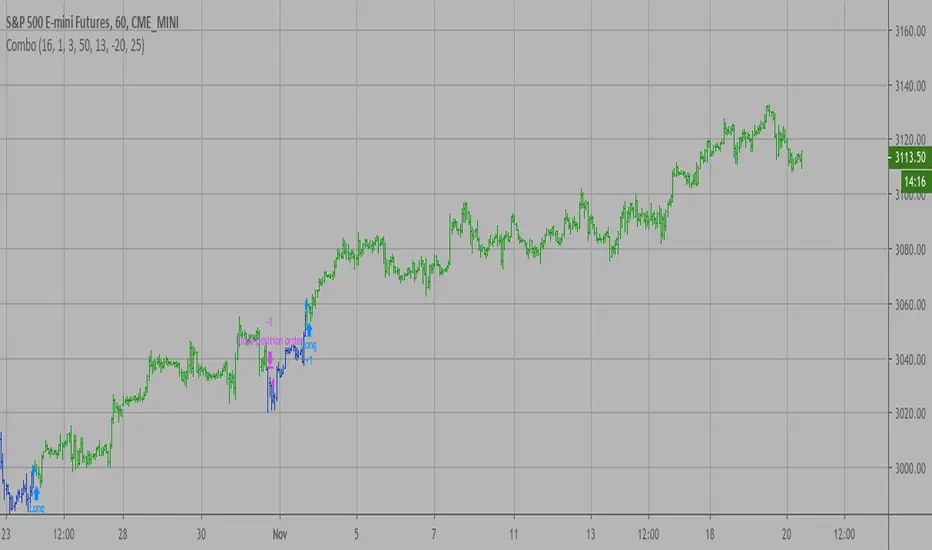
[STRATEGY] Jurik RSXA private strategy from the Profitable Jurik RSX preview for backtesting purposes.
M-oscillator

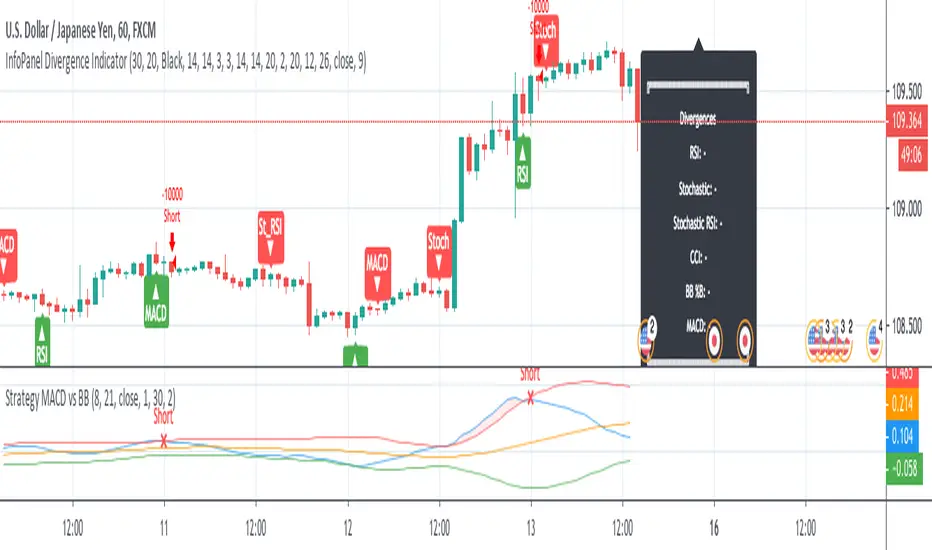
Strategy MACD vs BBStrategy based on MACD and Bollinger Bands, where BBs are calculatend from macd signal.
Strategy doesn't open at breakout of bands but it waits for a pullback.
Upper and lower bands are used as resistance and support.
There are various parameters that can be optimized.
I have also a study with alerts.
Please use comment section for any feedback or cointact me if you need support.
VuManChu/Noski B Backtester (Gold Dot)This is a backtest version of Vumanchu's original script Market Cipher-B. All credit goes to his original coding.
This has been coded to backtest "Gold dot" entries only, so please keep that in mind when using.
Hope this is helpful!

VuManChu/Noski B Backtester (Divergence Green/Red Dot)This is a backtest version of Vumanchu's original script Market Cipher-B. All credit goes to his original coding.
This has been coded to backtest the alert conditions "Buy (Big green circle +div) and Sell (Big red circle + div)" entries only from the original Cipher B script, so please keep that in mind when using.
Hope this is helpful!

VuManChu/Noski B Backtester (Small Green/Red Dot)This is a backtest version of Vumanchu's original script Market Cipher-B. All credit goes to his original coding.
This has been coded to backtest Small Red/Green dot entries only, so please keep that in mind when using.
Hope this is helpful!

NoSKi MC-B Backtester (Green/Red Dot)This is a backtest version of Vumanchu's original script Market Cipher-B. All credit goes to his original coding.
This has been coded to backtest Red/Green dot entries only, so please keep that in mind when using.
Hope this is helpful!

Leverage Strategy and a few words on risk/opportunityHello traders,
I started this script as a joke for someone... finally appears it could be used for educational content
Let's talk about leverage and margin call
Margin Call
A margin call is the broker's demand that an investor deposit additional money or securities so that the account is brought up to the minimum value, known as the maintenance margin.
A margin call usually means that one or more of the securities held in the margin account has decreased in value below a certain point.
Leverage
A leverage is a system which allows the trader to open positions much larger than his own capital. ... “Leverage” usually refers to the ratio between the position value and the investment needed,
Strat
The strategy simulates long/short positions on a 4h high/low breakout based on the chart candle close.
The panel below shows the strategy equity curve. Activating the margin call option will show when the account would be margin called giving the settings
Casino
I'm not doing any financial recommendation here.
I made this strategy so that people include more risk management metrics into their strategy.
From the code, we see it's fairly easy to calculate a leveraged position size and a margin call flag - when that flag is hit, the system stops trading.
I simplified things to the extreme here but my point is that the leverage is a double-edge sword gift.
Assuming we always take the same position sizing, increasing the leverage speed up how fast a margin could be ..... called. (bad joke? feel free to tell me). Not saying it will, saying it introduces more risk by design.
Then one could say "I'll just turn off that stupid margin call option". And that's when someone starts backtesting with unrealistic market conditions.
Finally...
When I backtest I always assume the worst in every scenario possible (because I'm French), I always try to minimize the risk first (also because I'm French), keeping as close from 0 as possible (French again)
Then I add the "opportunity" component, looking to catch the maximum of opportunity while keeping the risk low.
It's like a Rubix cube puzzle - decreasing the risk is one side of the equation but whenever I try to catch more opportunity... my risks increases.
Then I update my risk... and now the opportunity decreases... (#wut #wen #simple)
Completely removing the risk from a trading strategy isn't something I wouldn't dare doing.
Trading involves risk. Being obsessed by decreasing the risk is what I do BEST :)
Dave

Combo Backtest 123 Reversal & DAPD This is combo strategies for get a cumulative signal.
First strategy
This System was created from the Book "How I Tripled My Money In The
Futures Market" by Ulf Jensen, Page 183. This is reverse type of strategies.
The strategy buys at market, if close price is higher than the previous close
during 2 days and the meaning of 9-days Stochastic Slow Oscillator is lower than 50.
The strategy sells at market, if close price is lower than the previous close price
during 2 days and the meaning of 9-days Stochastic Fast Oscillator is higher than 50.
Second strategy
This indicator is similar to Bollinger Bands. It based on DAPD - Daily
Average Price Delta. DAPD is based upon a summation for each of the
highs (hod) for the 21 days prior to today minus the summation for
each of the lows (lod) for the last 21 days prior to today. The result
of this calculation would then be divided by 21.
It will be buy when high above previos DAPD high and sell if low below previos DAPD low
WARNING:
- For purpose educate only
- This script to change bars colors.

SuPeR-RePaNoCHa #2TP#This is the last of the 'RePaNoCHa' script for Automatic Trading ;-) ... This time with two take profits ...
It Use 6 indicators + volume:
-JURIK MOVING AVERAGE
-RANGE FILTER
-ADX
-PARABOLIC SAR
-RSI + VOLUME WEIGHTED
-MACD
-VOLUME
To close the position you can choose between 2 Take Profit and the amount to use on each one.
You can transform it yourself into 'study' mode to get alerts.
Take Profits can be generated from the same entry, (syntax example on the script) so the fees will be lower (0.04 + 0.02 / 2 = 0.03).
Settings for BINANCE FUTURES BTC:USDT
Enjoy...

Expert studio strategy 1 - GBPUSDThis is part of a series of strategies developed automatically by a online software.
I cannot share the site url, which is not related to me in any way, because it is against the TV reules.
This strategy was optimized for GBPUSD, timeframe 1D, fixed lots 0.1, initial balance 1000€.
LOGIC:
- LONG ENTRY when previous candle is bear
- LONG EXIT: RVI > signal line
- SHORT ENTRY when previous candle is bull
- SHORT EXIT: RVI < signal line
NOTE: I considered the open of actual candle instead of close otherwise there will be a back shift of 1 candle in pine script
Take profit = no
Stop loss = no
I have also a study with alarms.
Please use comment section for any feedback.

Combo Backtest 123 Reversal & D_Three Ten OscThis is combo strategies for get a cumulative signal.
First strategy
This System was created from the Book "How I Tripled My Money In The
Futures Market" by Ulf Jensen, Page 183. This is reverse type of strategies.
The strategy buys at market, if close price is higher than the previous close
during 2 days and the meaning of 9-days Stochastic Slow Oscillator is lower than 50.
The strategy sells at market, if close price is lower than the previous close price
during 2 days and the meaning of 9-days Stochastic Fast Oscillator is higher than 50.
Second strategy
TradeStation does not allow the user to make a Multi Data Chart with
a Tick Bar Chart and any other type a chart. This indicator allows the
user to plot a daily 3-10 Oscillator on a Tick Bar Chart or any intraday interval.
Walter Bressert's 3-10 Oscillator is a detrending oscillator derived
from subtracting a 10 day moving average from a 3 day moving average.
The second plot is an 16 day simple moving average of the 3-10 Oscillator.
The 16 period moving average is the slow line and the 3/10 oscillator is
the fast line.
For more information on the 3-10 Oscillator see Walter Bressert's book
"The Power of Oscillator/Cycle Combinations"
WARNING:
- For purpose educate only
- This script to change bars colors.

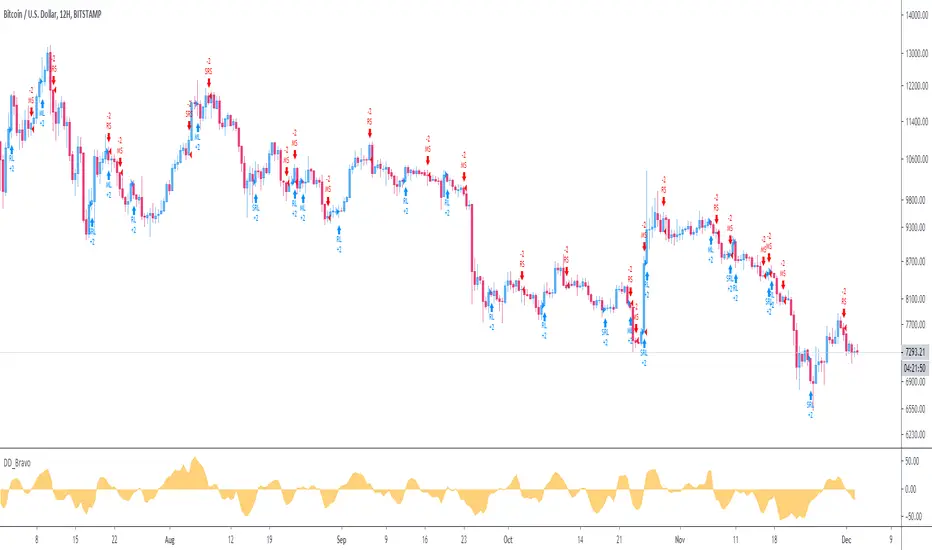
DD_Bravo_StrategyThe DD_Bravo_Strategy is a mean reversal strategy that captures oversold or overbought levels, and accordingly goes long or short. It is based on price difference between successive candles and normalization of this difference. It works best on 12H timeframe for BTCUSD.
DM me for details for access.
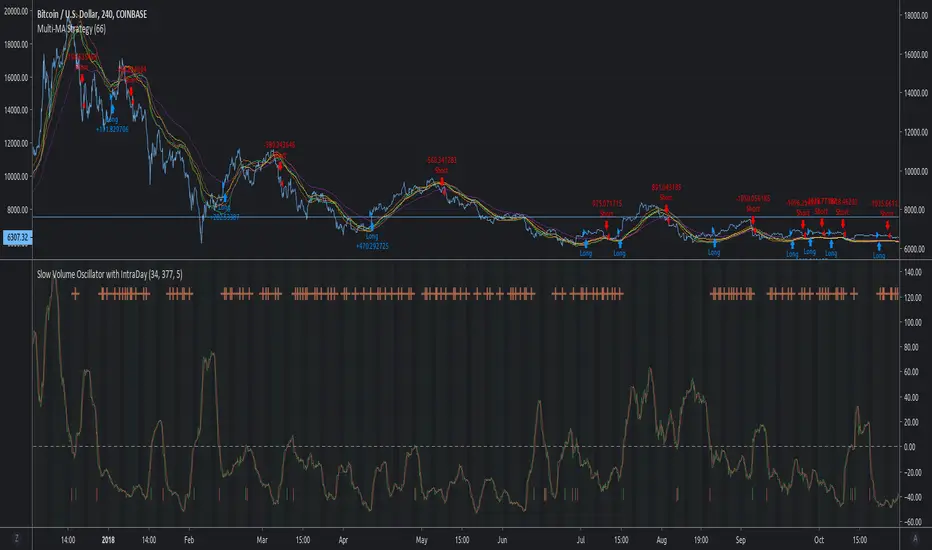
MACD Multi-MA StrategyThis script applies the average of each major MA (SMA, RMA, EMA, WVMA, WMA) to the MACD formula.
The logic is simple. When all 5 MA's are in agreement in direction, then then script will notify users of change.
I posted this as a strategy to help show how logic does in back test. If you use my simple yet effective solution to find take profit locations, you can blow this back testing out of the water!!!
To set alerts simply turn script into study
//@version=2
study(title="MACD Multi-MA Study", overlay=false)
src = close
len1 = input(8, "FAST LOOKBACK")
len2 = input(144, "SLOW LOOKBACK")
/////////////////////////////////////////////
length = len2-len1
ma = vwma(src, length)
plot(ma, title="VWMA", color=lime)
length1 = len2-len1
ma1 = rma(src, length1)
plot(ma1, title="RMA", color=purple)
length2 = len2-len1
ma2 = sma(src, length2)
plot(ma2, title="SMA", color=red)
length3 = len2-len1
ma3 = wma(src, length3)
plot(ma3, title="WMA", color=orange)
length4 = len2-len1
ma4 = ema(src, length4)
plot(ma4, title="EMA", color=yellow)
long = ma > ma and ma1 > ma1 and ma2 > ma2 and ma3 > ma3 and ma4 > ma4
short = ma < ma and ma1 < ma1 and ma2 < ma2 and ma3 < ma3 and ma4 < ma4
alertcondition(long == true, title='MACD LONG SIGNAL', message='MACD LONG!')
alertcondition(short == true, title='MACD SHORT SIGNAL', message='MACD SHORT!')
Pro CryptoSolver Strategy [Jwammo12]This is a pro strategy for trading crypto pairs. It trades both long and short and includes an adjustable stop loss.
Lowering the activity parameter increases the number of trades and is not bounded by zero.
Message me for a free 7-day trial and pricing for lifetime access.

[astropark] Crypto Swing Trading [strategy]Dear Followers,
today a Swing Trading Strategy , runnable on a bot , which works great from 30m timeframe and above. Best suggested timeframes are 1h and 4h.
If you are a scalper, you will love suggested entries for fast profit. You can run it from 1 minute timeframe if you are used to scalp trading and close each trade whenever you fell happy (a proper trailing stop strategy is suggested anyway).
This strategy can trigger till 5 or 20 buy or sell signals in a row before reverting (it changes greatly depending on timeframe you use), so use a proper money management .
Strategy results are calculated on the timeframe from January 2018 to now, so on about 2 years, using 10000$ as initial capital and working at 3x leverage (very safe leverage!).
This is not the "Holy Grail", so use a proper risk management strategy.
This script will let you backtest this script.
The alarms version of this indicator, which will let you set all notifications you may need in order to be alerted on each triggered signals, can be found by searching for "Crypto Swing Trading" and then choosing the "alarms" version.
This is a premium indicator , so send me a private message in order to get access to this script.

ALL.COIN.V1phiên bản này chỉ dùng cho ALL COIN, và chỉ dùng 1 lệnh duy nhất, khồn có gì chắc chắn 100% cả sẽ có lệnh thắng và thua, nhưng đối với chiến lược này giảm thiểu nhữung lệnh thua tới mức thấp nhất có thể, chiến lược chỉ dành cho biểu đồ 1 phút.
This version is only used for ALL COIN, and only one order is used, there is nothing 100% sure that there will be orders to win and lose, but for this strategy to minimize the loss of orders as much as possible, The strategy is only for 1 minute chart.

XBT.BTC.V1phiên bản này chỉ dùng cho sàn bitmex , và chỉ dùng 1 lệnh duy nhất, khồn có gì chắc chắn 100% cả sẽ có lệnh thắng và thua, nhưng đối với chiến lược này giảm thiểu nhữung lệnh thua tới mức thấp nhất có thể, chiến lược chỉ dành cho biểu đồ 1 phút.
This version is only used for bitmex, and only one order is available, there is nothing 100% sure that there will be orders to win and lose, but for this strategy, the order of losing orders is as low as possible. The strategy is only for the 1-minute chart.

Reticulata - StrategyThis is the backtesting script for Reticulata
Reticulata is the first of many scripts to come from Bull Bear Bots. It is an early release version and supports multiple trade logics.
The script works across various markets including Forex and Cryptocurrencies.
All of our scripts are designed for manual traders but are ready to use with automated trading bots.
www.bullbearbots.com

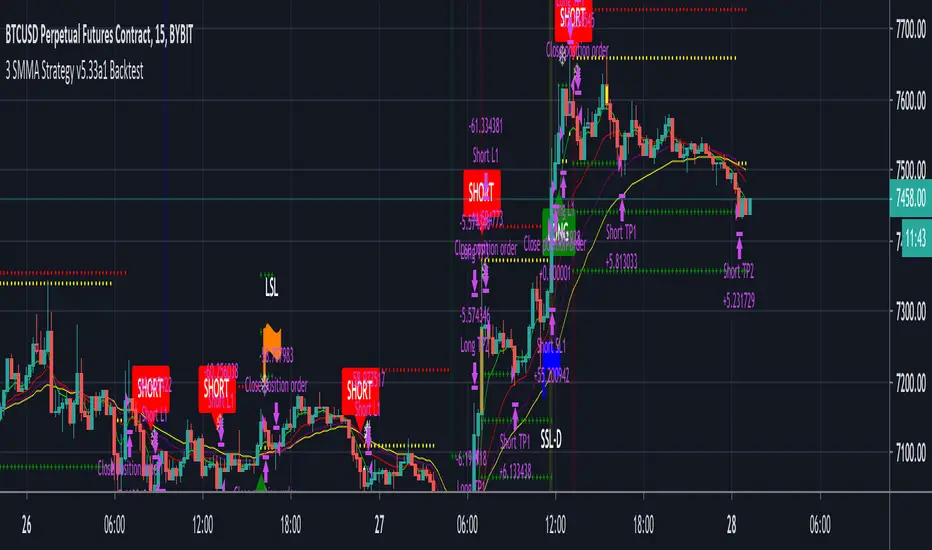
Black Hawk StrategyThis TradingView strategy looks at 4 SMMAs and tries to find crosses that initiate a long or short position.
This strategy also tries to look at certain scenarios where previous opportunities in the past have offered up good long & shorts.
There are 3 take profit points for this indicator. These values at the time at posting were the most optimal. You may find other scenarios that better fit your liking.
There are multiple stop-loss functions.
Yellow Dot contains:
A trailing stop that follows price action. It also includes a stop loss that is only executed if the price closes above/below it.
Red Dot contains:
Typical stop-loss that executes when reached.
#Disclaimer:
1. not a financial advisor.
2. I do not guarantee this script will provide consistent profits or that anyone can make money with it.
Combo Backtest 123 Reversal & D_ELI (Ehlers Leading Indicator) This is combo strategies for get a cumulative signal.
First strategy
This System was created from the Book "How I Tripled My Money In The
Futures Market" by Ulf Jensen, Page 183. This is reverse type of strategies.
The strategy buys at market, if close price is higher than the previous close
during 2 days and the meaning of 9-days Stochastic Slow Oscillator is lower than 50.
The strategy sells at market, if close price is lower than the previous close price
during 2 days and the meaning of 9-days Stochastic Fast Oscillator is higher than 50.
Second strategy
This Indicator plots a single
Daily DSP (Detrended Synthetic Price) and a Daily ELI (Ehlers Leading
Indicator) using intraday data.
Detrended Synthetic Price is a function that is in phase with the dominant
cycle of real price data. This one is computed by subtracting a 3 pole Butterworth
filter from a 2 Pole Butterworth filter. Ehlers Leading Indicator gives an advanced
indication of a cyclic turning point. It is computed by subtracting the simple
moving average of the detrended synthetic price from the detrended synthetic price.
Buy and Sell signals arise when the ELI indicator crosses over or under the detrended
synthetic price.
See "MESA and Trading Market Cycles" by John Ehlers pages 64 - 70.
WARNING:
- For purpose educate only
- This script to change bars colors.
💲SuPeR-RePaNoCHa💲 [Backtest]Script for automatic trading (Backtest). This is the second part of the previous RePanoCHa script but with Take Profit.
It Use 6 indicators + volume:
-JURIK MOVING AVERAGE
-RANGE FILTER (from Donovan Wall)
-ADX (ORIGINAL VERSION)
-PARABOLIC SAR
-RSI + VOLUME WEIGHTED
-MACD
-VOLUME
To close the position you can choose between Take Profit only, Trailing Stop only or both at the same time.

MarketCipher B Backtest (FOR TESTING ONLY, NOT SAFE TO TRADE)A script to backtest the strategy outlined. This is not a final version of the script and is therefore not safe to trade. If you choose to ignore this warning, trade at your own risk.
Combo Backtest 123 Reversal & Detrended Synthetic Price V 2 This is combo strategies for get a cumulative signal.
First strategy
This System was created from the Book "How I Tripled My Money In The
Futures Market" by Ulf Jensen, Page 183. This is reverse type of strategies.
The strategy buys at market, if close price is higher than the previous close
during 2 days and the meaning of 9-days Stochastic Slow Oscillator is lower than 50.
The strategy sells at market, if close price is lower than the previous close price
during 2 days and the meaning of 9-days Stochastic Fast Oscillator is higher than 50.
Second strategy
Detrended Synthetic Price is a function that is in phase with the
dominant cycle of real price data. This DSP is computed by subtracting
a half-cycle exponential moving average (EMA) from the quarter cycle
exponential moving average.
See "MESA and Trading Market Cycles" by John Ehlers pages 64 - 70.
WARNING:
- For purpose educate only
- This script to change bars colors.