Ultimate Trading StrategyDescription:
In this TradingView Pine Script publication, we introduce a powerful tool designed to enhance your trading strategies by combining the Exponential Moving Average (EMA) and the Relative Strength Index (RSI). This strategy is specifically tailored for the EGLD/USDT.P pair on Binance, using a 5-minute interval to capture timely trading opportunities in a volatile market.
Key Features:
Combining EMA and RSI for Robust Signals
This script combines the EMA, which helps identify the overall trend direction, with the RSI, which measures the speed and change of price movements to identify overbought and oversold conditions.
The combination ensures that you get high-probability signals by leveraging both trend-following and momentum-based indicators.
Multiple Timeframe Analysis
Analyze the EMA and RSI across different timeframes to gain a comprehensive view of market conditions and make more informed trading decisions.
Reversing and Extending Signals
Reverse signals generated by indicators to adapt to various market conditions.
Extend signals by specifying conditions such as "RSI cross AND EMA cross WITHIN 2 bars" to capture more nuanced trading opportunities.
Backtesting and Risk Management
Evaluate the performance of your strategies by feeding the results into a backtesting engine.
The strategy risks a maximum of 10% of the account on a single trade to maintain sustainable risk levels.
Available Indicators:
EMA (Exponential Moving Average)
Helps identify the overall trend direction.
Signals:
Long Entry: When the price closes above the EMA.
Short Entry: When the price closes below the EMA.
RSI (Relative Strength Index)
Measures the speed and change of price movements.
Signals:
Long Entry: When RSI is below the oversold level (30).
Short Entry: When RSI is above the overbought level (70).
How It Works:
Long Entry: A buy signal is generated when the price closes above the EMA and the RSI is below the oversold level (30). This indicates that the price is in an upward trend and temporarily oversold, presenting a potential buying opportunity.
Short Entry: A sell signal is generated when the price closes below the EMA and the RSI is above the overbought level (70). This indicates that the price is in a downward trend and temporarily overbought, presenting a potential selling opportunity.
Close Long Position: The script closes long positions when the conditions for a short entry are met.
Close Short Position: The script closes short positions when the conditions for a long entry are met.
Parameters:
EMA Length: 20 (default)
RSI Length: 14 (default)
RSI Overbought Level: 70 (default)
RSI Oversold Level: 30 (default)
Initial Capital: 10,000 USDT (default) – Realistic starting capital for an average trader.
Commission: 0.1% (default) – Reflects typical trading commissions.
Slippage: 0.5 ticks (default) – Accounts for market conditions and potential price slippage during order execution.
Backtesting:
Trading Range: – Ensure that the dataset used covers a significant period to generate a sufficient number of trades.
Dataset Limitation: Due to TradingView Premium's limitation of backtesting only 20,000 candles, it may not be possible to generate more than 100 trades. This limitation affects the statistical relevance of the backtesting results, but the strategy has been tested to provide meaningful insights within these constraints.
Use Case:
This strategy combines the EMA and RSI to identify potential trading opportunities by detecting trend direction and overbought/oversold conditions. It is particularly effective in volatile markets where quick trend reversals are common.
How to Use:
Set the parameters according to your preference or use the default values.
Run the script on the EGLD/USDT.P pair with a 5-minute interval.
Monitor the signals and adjust your trades accordingly.
ממוצעים נעים

Entry Fragger - Strategy
For basic instructions please visit my other script "Entry Fragger".
The Signal Logic is explained there.
v1.4:
- Added advanced backtesting with fully customizable entries.
- Fully automated Buy Signals (profitable).
- Adjustable timeframes for signal logic. (requested)
Every setting affects the accuracy and profitability greatly now, based on settings applied.
The strategy performs best on high timeframes with larger capital and no leverage.
Useless for Forex, but absolutely smashes stocks and crypto on mid to high timeframes.
Please read through my other scripts description.
Set values as preferred and try your assets.
It does NOT work on low timeframes and forex!
Hint: BTC 4H, Custom Timeframe 1h, Moon Mode and Show Sell Signals enabled, R2R: 2.

Kaufman Adaptive Moving Average (KAMA) Strategy [TradeDots]"The Kaufman Adaptive Moving Average (KAMA) Strategy" is a trend-following system that leverages the adaptive qualities of the Kaufman Adaptive Moving Average (KAMA). This strategy is distinguished by its ability to adjust dynamically to market volatility, enhancing trading accuracy by minimizing the effects of false and delayed signals often associated with the Simple Moving Average (SMA).
HOW IT WORKS
This strategy is centered around use of the Kaufman Adaptive Moving Average (KAMA) indicator, which refines the principles of the Exponential Moving Average (EMA) with a superior smoothing technique.
KAMA distinguishes itself by its responsiveness to changes in market prices through an "Efficiency Ratio (ER)." This ratio is computed by dividing the recent absolute net price change by the cumulative sum of the absolute price changes over a specified period. The resulting ER value ranges between 0 and 1, where 0 indicates high market noise and 1 reflects stronger market momentum.
Using ER, we could get the smoothing constant (SC) for the moving average derived using the following formula:
fastest = 2/(fastma_length + 1)
slowest = 2/(slowma_length + 1)
SC = math.pow((ER * (fastest-slowest) + slowest), 2)
The KAMA line is then calculated by applying the SC to the difference between the current price and the previous KAMA.
APPLICATION
For entering long positions, this strategy initializes when there is a sequence of 10 consecutive rising KAMA lines. Conversely, a sequence of 10 consecutive falling KAMA lines triggers sell orders for long positions. The same logic applies inversely for short positions.
DEFAULT SETUP
Commission: 0.01%
Initial Capital: $10,000
Equity per Trade: 80%
Users are advised to adjust and personalize this trading strategy to better match their individual trading preferences and style.
RISK DISCLAIMER
Trading entails substantial risk, and most day traders incur losses. All content, tools, scripts, articles, and education provided by TradeDots serve purely informational and educational purposes. Past performances are not definitive predictors of future results.

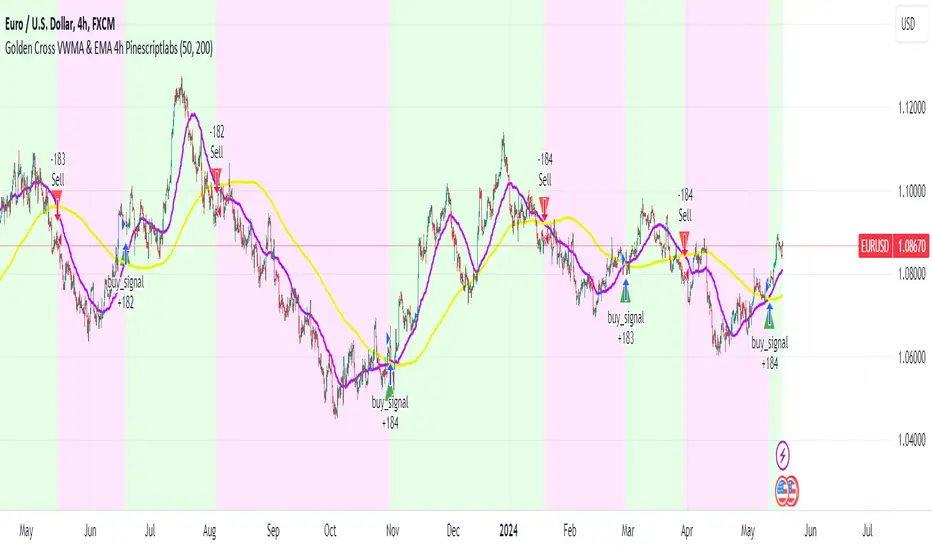
Golden Cross VWMA & EMA 4h PinescriptlabsThis strategy combines the 50-period Volume-Weighted Moving Average (VWMA) on the current timeframe with a 200-period Simple Moving Average (SMA) on the 4-hour timeframe. This combination of indicators with different characteristics and time horizons aims to identify strong and sustained trends across multiple timeframes.
The VWMA is a variant of the moving average that assigns greater weight to periods of higher volatility, helping to avoid misleading signals. On the other hand, the 4-hour SMA is used as an additional trend filter in a shorter-term horizon. By combining these two indicators, the strategy can leverage the strength of the VWMA to capture the main trend, but only when confirmed by the SMA in the lower timeframe.
Buy signals are generated when the VWMA crosses above the 4-hour SMA, indicating a potential bullish trend aligned in both timeframes. Sell signals occur on a bearish cross, suggesting a possible reversal of the main trend.
The default parameters are a 50-period VWMA and a 200-period 4-hour SMA. It is recommended to adjust these lengths according to the traded instrument and the desired timeframe. It is also crucial to use stop losses and profit targets to properly manage risk.
By combining indicators of different types and timeframes, this strategy aims to provide a more comprehensive view of trend strength.
Español:
Esta estrategia combina la Volume-Weighted Moving Average (VWMA) de 50 períodos en el timeframe actual con una Simple Moving Average (SMA) de 200 períodos en el timeframe de 4 horas. Esta combinación de indicadores de distinta naturaleza y horizontes temporales busca identificar tendencias fuertes y sostenidas en múltiples timeframes.
La VWMA es una variante de la media móvil que asigna mayor ponderación a los períodos de mayor volatilidad, lo que ayuda a evitar señales engañosas. Por otro lado, la SMA de 4 horas se utiliza como un filtro adicional de tendencia en un horizonte de corto plazo. Al combinar estos dos indicadores, la estrategia puede aprovechar la fortaleza de la VWMA para capturar la tendencia principal, pero sólo cuando es confirmada por la SMA en el timeframe menor.
Las señales de compra se generan cuando la VWMA cruza al alza la SMA de 4 horas, indicando una potencial tendencia alcista alineada en ambos horizontes temporales. Las señales de venta ocurren en el cruce bajista, sugiriendo una posible reversión de la tendencia principal.
Los parámetros predeterminados son: VWMA de 50 períodos y SMA de 4 horas de 200 períodos. Se recomienda ajustar estas longitudes según el instrumento operado y el horizonte temporal deseado. También es crucial utilizar stops y objetivos de ganancias para controlar adecuadamente el riesgo.
Al combinar indicadores de diferentes tipos y timeframes, esta estrategia busca brindar una visión más completa de la fuerza de la tendencia.
Trend Following Parabolic Buy Sell Strategy [TradeDots]The Trend Following Parabolic Buy-Sell Strategy leverages the Parabolic SAR in combination with moving average crossovers to deliver buy and sell signals within a trend-following framework.
This strategy synthesizes proven methodologies sourced from various trading tutorials available on platforms such as YouTube and blogs, enabling traders to conduct robust backtesting on their selected trading pairs to assess the strategy's effectiveness.
HOW IT WORKS
This strategy employs four key indicators to orchestrate its trading signals:
1. Trend Alignment: It first assesses the relationship between the price and the predominant trendline to determine the directional stance—taking long positions only when the price trends above the moving average, signaling an upward market trajectory.
2. Momentum Confirmation: Subsequent to trend alignment, the strategy looks for moving average crossovers as a confirmation that the price is gaining momentum in the direction of the intended trades.
3. Signal Finalization: Finally, buy or sell signals are validated using the Parabolic SAR indicator. A long order is validated when the closing price is above the Parabolic SAR dots, and similarly, conditions are reversed for short orders.
4. Risk Management: The strategy institutes a fixed stop-loss at the moving average trendline and a take-profit level determinable by a prefixed risk-reward ratio calculated from the moving average trendline. These parameters are customizable by the users within the strategy settings.
APPLICATION
Designed for assets exhibiting pronounced directional momentum, this strategy aims to capitalize on clear trend movements conducive to achieving set take-profit targets.
As a lagging strategy that waits for multiple confirmatory signals, entry into trades might occasionally lag beyond optimal timing.
Furthermore, in periods of consolidation or sideways movement, the strategy may generate several false signals, suggesting the potential need for additional market condition filters to enhance signal accuracy during volatile phases.
DEFAULT SETUP
Commission: 0.01%
Initial Capital: $10,000
Equity per Trade: 70%
Users are advised to adjust and personalize this trading strategy to better match their individual trading preferences and style.
RISK DISCLAIMER
Trading entails substantial risk, and most day traders incur losses. All content, tools, scripts, articles, and education provided by TradeDots serve purely informational and educational purposes. Past performances are not definitive predictors of future results.

IsAlgo - AI Trend Strategy► Overview:
The AI Trend Strategy employs a combination of technical indicators to guide trading decisions across various markets and timeframes. It uses a custom Super Trend indicator and an Exponential Moving Average (EMA) to analyze market trends and executes trades based on specific candlestick patterns. This strategy includes options for setting stop losses, take profit levels, and features an alert system for trade notifications.
► Description:
This strategy focuses on identifying the optimal "entry candle," which signals either a potential correction within the ongoing trend or the emergence of a new trend. The entry criteria for this candle are highly customizable, allowing traders to specify dimensions such as the candle's minimum and maximum size and body ratio. Additional settings include whether this candle should be the highest or lowest compared to recent candles and if a confirmation candle is necessary to validate the entry.
The Super Trend indicator is central to the strategy’s operation, dictating the direction of trades by identifying bullish or bearish trends. Traders have the option to configure trades to align with the direction of the trend identified by this indicator, or alternatively, to take positions counter to the trend for potential reversal strategies. This flexibility can be crucial during varying market conditions.
Additionally, the strategy incorporates an EMA alongside the Super Trend indicator to further analyze trend directions. This combined approach aims to reduce the occurrence of false signals and improve the strategy's overall trend analysis.
The learning algorithm is a standout feature of the AI Trend Strategy. After accumulating data from a predefined number of trades (e.g., after the first 100 trades), the algorithm begins to analyze past performances to identify patterns in wins and losses. It considers variables such as the distance from the current price to the trend line, the range between the highest and lowest prices during the trend, and the duration of the trend. This data informs the algorithm's predictions for future trades, aiming to improve accuracy and reduce losses by adapting to the evolving market conditions.
► Examples of Trade Execution:
1. In an Uptrend: The strategy might detect a suitable entry candle during a correction phase, which aligns with the continuing uptrend for a potential long trade.
2. In a Downtrend: Alternatively, the strategy might identify an entry candle at the end of a downtrend, suggesting a potential reversal or correction where a long trade could be initiated.
3. In an Uptrend: The strategy may also spot an entry candle at the end of an uptrend and execute a short trade, anticipating a reversal or significant pullback.
4. In a Downtrend: The strategy might find a suitable entry candle during a correction phase, indicating a continuation of the downtrend for a potential short trade.
These examples illustrate how the strategy identifies potential trading opportunities based on trend behavior and candlestick patterns.
► Features and Settings:
⚙︎ Trend: Utilizes a custom Super Trend indicator to identify the direction of the market trend. Users can configure the strategy to execute trades in alignment with this trend, take positions contrary to the trend, or completely ignore the trend information for their trading decisions.
⚙︎ Moving average: Employs an Exponential Moving Average (EMA) to further confirm the trend direction indicated by the Super Trend indicator. This setting can be used in conjunction with the Super Trend or disabled if preferred.
⚙︎ Entry candle: Defines the criteria for the candle that triggers a trade. Users can customize aspects such as the candle's size, body, and its relative position to previous candles to ensure it meets specific trading requirements before initiating a trade.
⚙︎ Learning algorithm: This component uses historical trade data to refine the strategy. It assesses various aspects of past trades, such as price trends and market conditions, to make more informed trading decisions in the future.
⚙︎ Trading session: Users can define specific trading hours during which the strategy should operate, allowing trades to be executed only during preferred market periods.
⚙︎ Trading days: This option enables users to specify which days the strategy should be active, providing the flexibility to avoid trading on certain days of the week if desired.
⚙︎ Backtesting: Enables a period during which the strategy can be tested over a selected start and end date, with an option to deactivate this feature if not needed.
⚙︎ Trades: Detailed configuration options include the direction of trades (long, short, or both), position sizing (fixed or percentage-based), the maximum number of open trades, and limitations on the number of trades per day or based on trend changes.
⚙︎ Trades Exit: Offers various strategies for exiting trades, such as setting limits on profits or losses, specifying the duration a trade should remain open, or closing trades based on trend reversal signals.
⚙︎ Stop loss: Various methods for setting stop losses are available, including fixed pips, based on Average True Range (ATR), or utilizing the highest or lowest price points within a designated number of previous candles. Another option allows for closing the trade after a specific number of candles moving in the opposite direction.
⚙︎ Break even: This feature adjusts the stop loss to a break-even point under certain conditions, such as reaching predefined profit levels, to protect gains.
⚙︎ Trailing stop: The trailing stop feature adjusts the stop loss as the trade moves into profit, aiming to secure gains while potentially capturing further upside.
⚙︎ Take profit: Up to three take profit levels can be established using various methods, such as a fixed amount of pips, risk-to-reward ratios based on the stop loss, ATR, or after a set number of candles that move in the direction of the trade.
⚙︎ Alerts: Includes a comprehensive alert system that informs the user of all significant actions taken by the strategy, such as trade openings and closings. It supports placeholders for dynamic values like take profit levels, stop loss prices, and more.
⚙︎ Dashboard: Provides a visual display of detailed information about ongoing and past trades on the chart, helping users monitor the strategy’s performance and make informed decisions.
► Backtesting Details:
Timeframe: 15-minute BTCUSD chart.
Initial Balance: $10,000.
Order Size: 4% of equity per trade.
Commission: 0.01%.
Slippage: 5 ticks.
Risk Management: Strategic stop loss settings are applied based on the most extreme price points within the last 18 candles.

Moving average strategyNAME : Moving average strategy
SUMMARY
Long when Short MA period > Long MA period
Exit when Short MA period < Long MA period
Long only strategy, but you can modify this script.
==============================
This strategy uses a moving average line.
It buys when the short-term moving average crosses the long-term moving average and sells when the long-term moving average crosses the short-term moving average.
You can use different moving average lines by setting the MA type.
You can use SMA, EMA, DEMA, TEMA, WMA, and VWMA.
You can also adjust the period of the moving average line.
Price Type sets the type of price that will be used for the moving average line. The options are Close price, Open price, High price, Low price, Typical price, and center price.
High MDD and long periods of sideways movement make it difficult to use in practice, even though the returns may seem high.
Hopefully, you can combine it with other indicators to create a good strategy.
Thank you.

Alligator + MA Trend Catcher [TradeDots]The "Alligator + MA Trend Catcher" is a trading strategy that integrates the William Alligator indicator with a Moving Average (MA) to establish robust entry and exit conditions, optimized for capturing trends.
HOW IT WORKS
This strategy combines the traditional William Alligator set up with an additional Moving Average indicator for enhanced trend confirmation, creating a user-friendly backtesting tool for traders who prefer the Alligator method.
The original Alligator strategy can frequently present fluctuations, even in well-established trends, leading to potentially premature exits. To mitigate this, we incorporate a Moving Average as a secondary confirmation measure to ensure the market trend has indeed shifted.
Here’s the operational flow for long orders:
Entry Signal: When the price rises above the Moving Average, it confirms a bullish market state. Enter if Alligator spread in an upward direction. The trade remains active even if the Alligator indicator suggests a trend reversal.
Exit Signal: The position is closed when the price falls below the Moving Average, and the Alligator spreads in the downward direction. This setup helps traders to maintain positions through the entirety of the trend for maximum gain.
APPLICATION
This strategy is tailored for assets with significant, well-defined trends, such as Bitcoin and Ethereum, which are known for their high volatility and substantial price movements.
This strategy offers a low win-rate but high reward configuration, making asset selection critical for long-term profitability. If you choose assets that lack strong price momentum, there's a high chance that this strategy may not be effective.
For traders seeking to maximize gains from large trends without exiting prematurely, this strategy provides an aggressive yet controlled approach to riding out substantial market waves.
DEFAULT SETUP
Commission: 0.01%
Initial Capital: $10,000
Equity per Trade: 80%
RISK DISCLAIMER
Trading entails substantial risk, and most day traders incur losses. All content, tools, scripts, articles, and education provided by TradeDots serve purely informational and educational purposes. Past performances are not definitive predictors of future results.

Multi Timeframe RSI Buy Sell Strategy [TradeDots]The "Multi Timeframe RSI Buy/Sell Strategy" is a trading strategy that utilizes Relative Strength Index (RSI) indicators from multiple timeframes to provide buy and sell signals.
This strategy allows for extensive customization, supporting up to three distinct RSIs, each configurable with its own timeframe, length, and data source.
HOW DOES IT WORK
This strategy integrates up to three RSIs, each selectable from different timeframes and customizable in terms of length and source. Users have the flexibility to define the number of active RSIs. These selections visualize as plotted lines on the chart, enhancing interpretability.
Users can also manage the moving average of the selected RSI lines. When multiple RSIs are active, the moving average is calculated based on these active lines' average value.
The color intensity of the moving average line changes as it approaches predefined buying or selling thresholds, alerting users to potential signal generation.
A buy or sell signal is generated when all active RSI lines simultaneously cross their respective threshold lines. Concurrently, a label will appear on the chart to signify the order placement.
For those preferring not to display order information or activate the strategy, an "Enable backtest" option is provided in the settings for toggling activation.
APPLICATION
The strategy leverages multiple RSIs to detect extreme market conditions across various timeframes without the need for manual timeframe switching.
This feature is invaluable for identifying divergences across timeframes, such as detecting potential short-term reversals within broader trends, thereby aiding traders in making better trading decisions and potentially avoiding losses.
DEFAULT SETUP
Commission: 0.01%
Initial Capital: $10,000
Equity per Trade: 60%
RISK DISCLAIMER
Trading entails substantial risk, and most day traders incur losses. All content, tools, scripts, articles, and education provided by TradeDots serve purely informational and educational purposes. Past performances are not definitive predictors of future results.
TradeDots Stochastic Z-Score

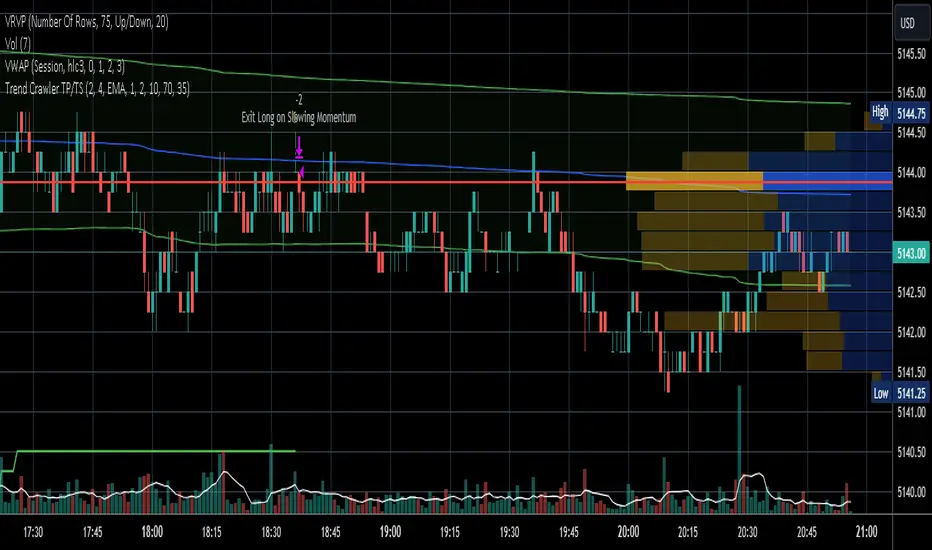
Trend Crawler with Dynamic TP and Trailing Stop### Description of "Trend Crawler with Dynamic TP and Trailing Stop"
#### Overview
The "Trend Crawler with Dynamic TP and Trailing Stop" is a comprehensive trading strategy designed for medium-frequency trading on various timeframes and markets. It utilizes a combination of trend identification and volatility analysis to determine optimal entry and exit points, aiming to maximize profitability by adapting to changing market conditions.
#### Strategy Mechanics
1. **Moving Averages**: Users can select between Simple Moving Average (SMA) and Exponential Moving Average (EMA) to define the trend. The strategy uses two moving averages (fast and slow) to identify the trend direction. A crossover of the fast MA above the slow MA signals a potential bullish trend, while a crossunder signals a bearish trend.
2. **Volume Analysis**: The strategy incorporates volume analysis to confirm the strength of the trend. It calculates a standard deviation of volume from its moving average to detect significant increases in trading activity, which supports the trend direction indicated by the MAs.
3. **Price Spread and RSI**: It uses the price spread (difference between the close and open of each bar) and the Relative Strength Index (RSI) to filter entries based on market momentum and overbought/oversold conditions. This helps in refining the entries to avoid weak or overly extended moves.
4. **Dynamic Take Profit and Trailing Stop**:
- **Trailing Stop**: As the position moves into profit, the strategy adjusts the stop loss dynamically to protect gains, using a trailing stop mechanism.
- **Dynamic Take Profit**: The take profit levels are adjusted based on the volatility (measured by the standard deviation of the price spread) to capture maximum profit from significant moves.
#### Usage
To use the strategy:
- Set the desired moving average type and lengths according to the asset and timeframe being traded.
- Adjust the RSI thresholds to match the market's volatility and trading style.
- Set the base take profit and stop loss levels along with the trailing stop distance based on risk tolerance and trading objectives.
#### Justification for Originality
While the use of moving averages, RSI, and volume analysis may be common, the integration of these elements with dynamic adjustments for take profit and trailing stops based on real-time volatility analysis offers a unique approach. The strategy adapts not just to trend direction but also to the market's momentum and volatility, providing a tailored trading solution that goes beyond standard indicator-based strategies.
#### Strategy Results and Settings
Backtesting should be conducted with realistic account sizes and include considerations for commission and slippage to ensure that the results are not misleading. Risk per trade should be kept within a sustainable range (ideally less than 5% of account equity), and the strategy should be tested over a sufficient sample size (at least 100 trades) to validate its effectiveness.
#### Chart Presentation
The script’s output includes:
- Colored backgrounds to indicate bullish or bearish market conditions.
- Plots of trailing stops to visually manage risk.
- Entry points are marked with shapes on the chart, providing clear visual cues for trading decisions.
#### Conclusion
This strategy offers traders a robust framework for trend following with enhanced risk management through dynamic adjustments based on real-time market analysis. It's designed to be versatile and adaptable to a wide range of markets and trading styles, providing traders with a tool that not only follows trends but also adapts to market changes to secure profits and reduce losses.
Price Based Z-Trend - Strategy [presentTrading]█ Introduction and How it is Different
Z-score: a statistical measurement of a score's relationship to the mean in a group of scores.
Simple but effective approach.
The "Price Based Z-Trend - Strategy " leverages the Z-score, a statistical measure that gauges the deviation of a price from its moving average, normalized against its standard deviation. This strategy stands out due to its simplicity and effectiveness, particularly in markets where price movements often revert to a mean. Unlike more complex systems that might rely on a multitude of indicators, the Z-Trend strategy focuses on clear, statistically significant price movements, making it ideal for traders who prefer a streamlined, data-driven approach.
BTCUSD 6h LS Performance
█ Strategy, How It Works: Detailed Explanation
🔶 Calculation of the Z-score
"Z-score is a statistical measurement that describes a value's relationship to the mean of a group of values. Z-score is measured in terms of standard deviations from the mean. If a Z-score is 0, it indicates that the data point's score is identical to the mean score. A Z-score of 1.0 would indicate a value that is one standard deviation from the mean. Z-scores may be positive or negative, with a positive value indicating the score is above the mean and a negative score indicating it is below the mean."
The Z-score is central to this strategy. It is calculated by taking the difference between the current price and the Exponential Moving Average (EMA) of the price over a user-defined length, then dividing this by the standard deviation of the price over the same length:
z = (x - μ) /σ
Local
🔶 Trading Signals
Trading signals are generated based on the Z-score crossing predefined thresholds:
- Long Entry: When the Z-score crosses above the positive threshold.
- Long Exit: When the Z-score falls below the negative threshold.
- Short Entry: When the Z-score falls below the negative threshold.
- Short Exit: When the Z-score rises above the positive threshold.
█ Trade Direction
The strategy allows users to select their preferred trading direction through an input option.
█ Usage
To use this strategy effectively, traders should first configure the Z-score thresholds according to their risk tolerance and market volatility. It's also crucial to adjust the length for the EMA and standard deviation calculations based on historical performance and the expected "noise" in price data.
The strategy is designed to be flexible, allowing traders to refine settings to better capture profitable opportunities in specific market conditions.
█ Default Settings
- Trade Direction: Both
- Standard Deviation Length: 100
- Average Length: 100
- Threshold for Z-score: 1.0
- Bar Color Indicator: Enabled
These settings offer a balanced starting point but can be customized to suit various trading styles and market environments. The strategy's parameters are designed to be adjusted as traders gain experience and refine their approach based on ongoing market analysis.
Z-score is a must-learn approach for every algorithmic trader.

Pullback_Power [JackTz]Welcome to Pullback_Power
Pullback_Power is a scalping strategy designed to capitalize on market retracements while incorporating unique dynamic features to enhance profitability.
Calculation
Pullback_Power purely uses moving averages to calculate both entry and exits. Exits can also be set to fixed percentages for both take profit and stop loss.
How the Strategy Works
Statistics show that markets normally do a recovery after each drop. Crypto markets can easily drop up to 20% within a few hours and then do a complete or partial recovery. Pullback_Power utilizes this known pattern alongside pyramiding. The strategy aims to catch one or more entries when the price drops, hoping to make profits when the market recovers from the drop. The fixed take profit and stop loss can be used to define your risk management, while the dynamic exit opportunity is riskier but provides the ability to stay in the trade longer while it recovers. Pullback_Power can make up to four entries. This means it utilizes pyramiding to spread out the entry points, but every exit is a full exit. It is not possible to partially exit.
Utility
Pullback_Power is a scalping strategy suitable for traders who operate with small trades and don't want to stay in the market for too long. Pullback_Power offers precise signals with no repainting. The strategy thrives in volatility, so crypto pairs might yield the best results, although this strategy can be adapted to work on all pairs and markets.
How to Automate It
Pullback_Power utilizes the standard placeholders of strategies on TradingView. This enables the trader to add every data point into a webhook, making it fully flexible to suit every trader's needs. To automate, create an alert, set the webhook URL, and add the JSON body needed for the webhook. An example of a simple JSON webhook with some of the standard strategy placeholders:
{
"side": "{{strategy.order.action}}",
"symbol": "{{ticker}}",
"amount": "{{strategy.order.contracts}}"
}
Read about all the standard placeholders that you can use here: TradingView - Standard strategy placeholders
Originality
Pullback_Power is unique in its ability to create precise signals without repainting while maintaining a solid approach to the pullback strategy. Its simplicity not only makes the strategy easy to use and understand but also highly effective. The simplicity reduces inputs, eliminating overfitting and limits each input to avoid incorrect usage. Many times, default settings are enough to achieve good backtesting results on almost all pairs available. Pullback_Power also differs from many other strategies by its solid code, which enhances performance and provides more reliable backtesting. The clean code increases the resilience and precision of the entries, making it less prone to errors.
Many pullback/scalping strategies normally only works on specific scopes of timeframes or pairs. Pullback_Power can easily be adapted to work on almost every scenario. The biggest change needed is the length of the moving average. The lower the timeframe, the higher a length is needed for proper results. I.e. on a 2H timeframe a length of 3 can yield good results. On a 5min timeframe the length might need to be as high as 70.
How to Use
To use Pullback_Power, add the script to your trading chart. By default, Pullback_Power opens four orders to optimize trade opportunities with a default fee value set at 0.1%. You can change these default settings in the Settings window under the Properties tab. To tailor Pullback_Power to your individual trading style, navigate to the Settings under the Input tab. Here you can configure various inputs to fit your trading style.
- Backtest settings , Start Date:
Defines the date of when the calculation starts. Use this to set the date of when the first trade could potentially emit.
- Backtest settings , End Date:
Defines the date of when the calculation ends. If there are any open trades after this date the close calculations are still live. It only makes sure that new orders cannot be opened after this date.
- Backtest settings , Only trade on weekdays:
This is a toggle you can enable or disable. If enabled it only allows new entries to happen during the normal week days, meaning Monday, Tuesday, Wednesday, Thursday and Friday.
Disable this to enable the script to open trades on all 7 days of the week.
- Open settings , Use dynamic long positions:
This toggle allows you to enable or disable the pullback level calculations after first trade.
If enabled, the calculations of level 2, 3 and 4 continues to happen after each bar, making the levels follow the price with the moving averages calculations.
If disabled, the calculations of the levels stop after the first trade. This means that the levels calculation at the point of the first trade stay fixed until all trades are closed.
You can see the difference of the green lines on the chart when you toggle this flag.
- Open settings , Data type:
This is the bar data used for the moving average calculation when opening trades. The possible data types are Open, High, Low, Close, HL2, HLC3, OHLC4, OC2 and HC2.
- Open settings , Source type:
This is the source used to calculate the moving average. The types available are: SMA, PCMA, EMA, WMA, DEMA, ZLEMA and HMA.
- Open settings , Length:
This is the length used for the moving average calculations. 3 means it takes the last 3 bars of historical data for the calculation.
- Open settings , Offset:
This defines if the calculation should use an offset for the historical data. This does not use a look-forward feature, but a look-backward feature. To prevent any possible repaints the offset can only be positive, not negative.
For instance, if the length is 3 and the offset is 0 the calculation is made from the last 3 bars, making it bar1, bar2 and bar3. If the length is 3 and the offset is 1 the calculation is made from bar2, bar3, and bar4 – offsetting the calculation by 1 bar.
- Leverage settings , Leverage liquidation (1-125):
The script itself does not handle any custom leverage calculation – this must be done in the Properties tabs and increasing the order size.
This setting is made to test a possible liquidation event if using leverage.
By setting this to higher than 1, a red line is visible after the first trade on the chart. This indicates the liquidation price.
If this setting is set to 25, the script will calculate the liquidation price from a x25 leverage. If this price is hit, the scripts stops emitting any orders and the background turns red.
You can use this to test if your settings could handle a certain level of leverage.
- Pullback settings , Pullback 1, 2, 3 and 4:
Each of these settings defines the entry price of each pullback level. If Pullback 1 is set to -6 it means that the moving average calculation should be 6% lower than the actual price.
The same logic applies to Pullback 2, 3 and 4.
Setting any level to 0 will disable the level – eliminating any orders to emit on that level.
This can be used to change the level of pyramiding down from 4 if needed.
If you do this, remember to also change the order size and the pyramiding value in the Properties tab accordingly.
- Close settings , Use dynamic TP and SL:
If enabled, script will exit all orders using the same but separate algorithm for moving averages. This enables the user to define if you want the orders to be closed if the price level of this moving average is hit. The price level for this calculation is visible on the chart by the blue line.
Although you can change the length and offset, as described underneath, this calculation uses the same data and source type defined in the Open settings area.
- Close settings , Length, Close:
This is the length used for the closing moving average calculations. 3 means it takes the last 3 bars of historical data for the calculation.
- Close settings , Offset, Close:
This defines if the calculation for the closing moving average should use an offset for the historical data. Just as the offset used for opening order, this does not use a look-forward feature, but a look-backward feature. To prevent any possible repaints the offset can only be positive, not negative.
For instance, if the length is 3 and the offset is 0 the calculation is made from the last 3 bars, making it bar1, bar2 and bar3. If the length is 3 and the offset is 1 the calculation is made from bar2, bar3, and bar4 – offsetting the calculation by 1 bar.
- Close settings , Use TakeProfit:
This toggle enables/disables a fixed take profit percentage.
- Close settings , TP %:
This sets the wanted % to reach on a take profit. This setting is ignored if the toggle above is disabled.
- Close settings , Use StopLoss:
This toggle enables/disables a fixed stop loss percentage.
- Close settings , SL %:
This sets the wanted % to reach on a stop loss. This setting is ignored if the toggle above is disabled.
Exit on Same Bar as Entry
By default, the script doesn't emit any exit orders on the same bar as the first entry order. Enable "Recalculation: After order is filled" to change this behavior.
Troubleshooting
While Pullback_Power is designed to provide reliable trading signals, you may encounter rare issues. One such issue could be receiving an error message stating "can't open orders with 0 or negative qty." If you encounter this error, it is likely due to specific conditions on the selected timeframe. To resolve this issue, change the timeframe on your trading chart.
Underlying Principles and Value Proposition
Pullback_Power leverages moving averages and volatility behavior to identify market retracements and capitalize on them. The strategy is rooted in the understanding that markets often experience temporary reversals or "pullbacks" before resuming their primary trend. By identifying these pullbacks and entering trades at opportune moments, Pullback_Power aims to capture quick profits from short-term market movements.
The dynamic and fixed calculations of Take Profit (TP) and Stop Loss (SL) levels enhances risk management, ensuring that potential losses are controlled while allowing room for profits to grow. The adaptive approach using the moving averages considers current market conditions, making the strategy flexible and responsive to changing volatility.
Moreover, Pullback_Power's non-repainting nature ensures the reliability of its signals, eliminating hindsight bias and providing traders with actionable insights based on real-time market data.
The strategy's simplicity and effectiveness make it accessible for traders of all experience levels. Whether you're a beginner looking to start scalping or an experienced trader seeking to diversify your trading approach, Pullback_Power offers a balanced blend of simplicity and sophistication to help you navigate the markets with confidence.
By focusing on clear, transparent principles and offering practical tools for risk management, Pullback_Power aims to provide tangible value to traders, empowering them to make informed decisions and optimize their trading outcomes.
Thank you for choosing Pullback_Power. I wish you successful trading!

Strategy Container_Variable Pyramiding & Leverage [Tradingwhale]This is a strategy container . It doesn’t provide a trading strategy. What it does is provide functionality that is not readily available with standard strategy ’shells.’
More specifically, this Strategy Container enables Tradingview users to create trading strategies without knowing any Pine Script code .
Furthermore, you can use most indicators on tradingview to build a strategy without any coding at all, whether or not you have access to the code.
To illustrate a possible output in the image (buy and sell orders) of this strategy container, we are using here an indicator that provides buy and sell signals, only for illustration purposes. Again, this is a strategy container, not a strategy. So we need to include an indicator with this published strategy to be able to show the strategy execution.
What can you do with this strategy container? Please read below.
Trade Direction
You can select to trade Long trades only, Short trades only, or both, assuming that whatever strategy you create with this container will produce buy and sell signals.
Exit on Opposite
You can select if Long signals cause the exit of Short positions and vice versa. If you turn this on, then a sell/short signal will cause the closing of your entire long position, and a buy/long signal will cause the closing of your entire short position.
Use external data sources (indicators) to (a) import signals, or (b) create trading signals using almost any of the indicators available on Tradingview.
Option 1:
When you check the box ‘Use external indicator Buy & Sell signals?’ and continue to select an external indicator that plots LONG/BUY signals as value '1' and SHORT/SELL signals as value '-1, then this strategy container will use those signals for the strategy, in combination with all other available settings.
Here an example of code in an indicator that you could use to import signals with this strategy container:
buy = long_cond and barstate.isconfirmed
sell = short_cond and barstate.isconfirmed
//—------- Signal for Strategy
signal = buy ? 1 : sell ? -1 : 0
plot(plot_connector? signal : na, title="OMEGA Signals", display = display.none)
Option 2:
You can create buy/long and sell/short signals from within this strategy container under the sections called “ Define 'LONG' Signal ” and “ Define 'SHORT' Signal .”
You can do this with a single external indicator, by comparing two external indicators, or by comparing one external indicator with a fixed value. The indicator/s you use need to be on the same chart as this strategy container. You can add up to two (2) external indicators that can be compared to each other at a time. A checkbox allows you to select whether the logical operation is executed between Source #1 and #2, between Source # 1 and an absolute value, or just by analyzing the behavior of Source #1.
Without an image of the strategy container settings it’s a bit hard to explain. However, below you see a list of all possible operations.
Operations available , whenever possible based on source data, include:
- "crossing"
- "crossing up"
- "crossing down"
- "rejected from resistance (Source #1) in the last bar", which means ‘High’ was above Source #1 (resistance level) in the last completed bar and 'Close' (current price of the symbol) is now below Source #1" (resistance level).
- "rejected from resistance (Source #1) in the last 2 bars", which means ‘High’ was above Source #1 (resistance level) in one of the last two (2) completed bars and 'Close' (current price of the symbol) is now below Source #1" (resistance level).
- "rejected from support (Source #1) in the last bar" --- similar to above except with Lows and rejection from support level
- "rejected from support (Source #1) in the last 2 bars" --- similar to above except with Lows and rejection from support level
- "greater than"
- "less than"
- "is up"
- "is down"
- "is up %"
- "is down %"
Variable Pyramiding, Leverage, and Pyramiding Direction
Variable Pyramiding
With this strategy container, you can define how much capital you want to invest for three consecutive trades in the same direction (pyramiding). You can define what percentage of your equity you want to invest for each pyramid-trade separately, which means they don’t have to be identical.
As an example: You can invest 5% in the first trade let’s call this pyramid trade #0), 10% in the second trade (pyramid trade #1), and 7% in the third trade (pyramid trade #2), or any other combination. If your trading strategy doesn’t produce pyramid trading opportunities (consecutive trades in the same direction), then the pyramid trade settings won’t come to bear for the second and third trades, because only the first trade will be executed with each signal.
Leverage
You can enter numbers for the three pyramid trades that are combined greater than 100%. Once that is the case, you are using leverage in your trades and have to manage the risk that is associated with that.
Pyramiding Direction
You can decide to scale only into Winners, Losers, or Both. Pyramid into a:
- Losers : A losing streak occurs when the price of the underlying security at the current signal is lower than the average cost of the position.
- Winners : A winning streak occurs when the price of the underlying security at the current signal is higher than the average cost of the position.
- Both means that you are selecting to scale/pyramid into both Winning and Losing streaks.
Other Inputs that influence signal execution:
You can choose to turn these on or off.
1. Limit Long exits with a WMA to stay longer in Long positions: If you check this box and enter a Length number (integer) for the WMA (Weighted Moving Average), then Long positions can only be exited with short signals when the current WMA is lower than on the previous bar/candle. Short signals sometimes increase with uptrends. We’re using this WMA here to limit short signals by adding another condition (WMA going down) for the short signal to be valid.
2. Maximum length of trades in the number of candles. Positions that have been in place for the specified number of trades are excited automatically.
3. Set the backtest period (from-to). Only trades within this range will be executed.
4. Market Volatility Adjustment Settings
- Use ATR to limit when Long trades can be entered (enter ATR length and Offset). We’re using the 3-day ATR here, with your entries for ATR length and offset. When the 3-day ATR is below its signal line, then Long trades are enabled; otherwise, they are not.
- Use VIX to limit when Short trades can be entered (enter VIX). If you select this checkbox, then Short trades will only be executed if the daily VIX is above your set value.
- Use Momentum Algo functions to limit Short trades. This uses the average distance of Momentum Highs and Lows over the lookback period to gauge whether markets are calm or swinging more profoundly. Based on that you can limit short entries to more volatile market regimes.
Set:
- Fast EMA and Slow EMA period lengths
- Number of left and right candles for High and Low pivots
- Lookback period to calculate the High/Low average and then the distance between the two.
The assumption here is that greater distances between momentum highs and lows correlate positively with greater volatility and greater swings in the underlying security.
Stop-Loss
Set separate stop-losses based on % for Long and Short positions. If the position loses X% since entry, then the position will be closed.
Take-Profit
Set separate take-profit levels based on % for Long and Short positions. If the position wins X% since entry, then the position will be closed.

GM-8 and ADX Strategy with Second EMADescription:
This TradingView script implements a trading strategy based on the Moving Average (GM-8), the Average Directional Index (ADX), and the second Exponential Moving Average (EMA). The strategy utilizes these indicators to identify potential buy and sell signals on the chart.
Indicators:
GM-8 (Moving Average 8): This indicator calculates the average price of the last 8 periods and is used to identify trends.
ADX (Average Directional Index): The ADX measures the strength of a trend and is used to determine whether the market is moving in a particular direction or not.
Second EMA (Exponential Moving Average): This is an additional EMA line with a period of 59, which is used to provide additional confirmation signals for the trend.
Trading Conditions:
Buy Condition: A buy signal is generated when the closing price is above the GM-8 and the second EMA, and the ADX value is above the specified threshold.
Sell Condition: A sell signal is generated when the closing price is below the GM-8 and the second EMA, and the ADX value is above the specified threshold.
Trading Logic:
If a buy condition is met, a long position is opened with a user-defined lot size.
If a sell condition is met, a short position is opened with the same user-defined lot size.
Positions are closed when the opposite conditions are met.
User Parameters:
Users can adjust the periods for the GM-8, the second EMA, and the ADX, as well as the threshold for the ADX and the lot size according to their preferences.
Note:
This script has been developed for use on a $100,000 account with FTMO, therefore the account size is set to $100,000. Please ensure that the strategy parameters and settings meet the requirements of your trading strategy and carefully review the results before committing real capital.
--------------------------------------------------------------------------------------------------------------
Beschreibung:
Dieses TradingView-Skript implementiert eine Handelsstrategie, die auf dem gleitenden Mittelwert (GM-8), dem Average Directional Index (ADX) und der zweiten exponentiellen gleitenden Durchschnittslinie (EMA) basiert. Die Strategie verwendet diese Indikatoren, um potenzielle Kauf- und Verkaufssignale auf dem Chart zu identifizieren.
Indikatoren:
GM-8 (Gleitender Mittelwert 8): Dieser Indikator berechnet den Durchschnittspreis der letzten 8 Perioden und wird verwendet, um Trends zu identifizieren.
ADX (Average Directional Index): Der ADX misst die Stärke eines Trends und wird verwendet, um festzustellen, ob sich der Markt in eine bestimmte Richtung bewegt oder nicht.
Zweite EMA (Exponential Moving Average): Dies ist eine zusätzliche EMA-Linie mit einer Periode von 59, die verwendet wird, um zusätzliche Bestätigungssignale für den Trend zu liefern.
Handelsbedingungen:
Kaufbedingung: Es wird ein Kaufsignal generiert, wenn der Schlusskurs über dem GM-8 und der zweiten EMA liegt und der ADX-Wert über dem angegebenen Schwellenwert liegt.
Verkaufsbedingung: Es wird ein Verkaufssignal generiert, wenn der Schlusskurs unter dem GM-8 und der zweiten EMA liegt und der ADX-Wert über dem angegebenen Schwellenwert liegt.
Handelslogik:
Wenn eine Kaufbedingung erfüllt ist, wird eine Long-Position mit einer benutzerdefinierten Losgröße eröffnet.
Wenn eine Verkaufsbedingung erfüllt ist, wird eine Short-Position mit derselben benutzerdefinierten Losgröße eröffnet.
Positionen werden geschlossen, wenn die Gegenbedingungen erfüllt sind.
Benutzerparameter:
Benutzer können die Perioden für den GM-8, die zweite EMA und den ADX sowie den Schwellenwert für den ADX und die Losgröße nach ihren eigenen Präferenzen anpassen.
Hinweis:
Dieses Skript wurde für die Verwendung auf einem $100.000-Konto bei FTMO entwickelt, daher ist die Kontogröße auf $100.000 festgelegt. Bitte stellen Sie sicher, dass die Strategieparameter und -einstellungen den Anforderungen Ihrer Handelsstrategie entsprechen und dass Sie die Ergebnisse sorgfältig überprüfen, bevor Sie echtes Kapital einsetzen.

Advanced Trend Strategy [BITsPIP]The BITsPIP team is super excited to share our latest trading gem with you all. We're all about diving deep and ensuring our strategies can stand the test of time. So, we invite you to join us in exploring the awesome potential of this new strategy and really put it through its pace with some deep backtesting. This isn't just another strategy; it boasts a profit factor hovering around 1.5 across over 1000 trades, which is quite an achievement. Consider integrating it with your trading bots to further enhance your trading efficiency and profit generation. Curious? Ask for trial access or drop by our website for more details.
I. Deep Backtesting
We're all in on transparency and solid results, which is why we didn't stop at 100... or even 500 trades. We went over 1000, making sure this strategy is as robust as they come. No flimsy forecasts or sneaky repainting here. Just good, solid strategy that's ready for the real deal. Curious about the details? Check out our detailed backtesting screenshot for the BINANCE:BTCUSDT in a 5-minute timeframe. It's all about giving you the clear picture.
#No Overfitting
#No Repainting
Backtesting Screenshot
II. Algorithmic Trading
Thinking of trading as a manual game? Think again! Manual trading is a bit like rolling the dice - fun, but kind of risky if you're aiming for consistent wins. Instead, why not lean into the future with algorithmic trading? It's all about trusting the market's rhythm over the long term. By integrating your strategy with a trading bot, you can enjoy peace of mind, rest easy, and keep those emotional trades at bay.
III) Applications
Dive into the Advanced Trend Strategy, your versatile tool for navigating the market's waters. This strategy shines in under an hour timeframes, offering adaptability across stocks, commodities, forex, and cryptocurrencies. Initially fine-tuned for low-volatility cryptos like BINANCE:BTCUSDT , its default settings are a solid starting point.
But here's where your expertise comes into play. Each market beats to its own drum, necessitating nuanced adjustments to stop loss and take profit settings. This customization is key to maximizing the strategy's effectiveness in your chosen arena.
IV) Strategy's Logic
The Advanced Trend Strategy is a powerhouse, blending the precision of Hull Suite, RSI, and our unique trend detector technique. At its core, it’s designed for savvy risk management, aiming to lock in substantial profits while steering clear of minor market ripples. It utilizes stop-loss and take-profit thresholds to form a profit channel, providing a safety net for each trade. This is a trend-following strategy at heart, where these profit channels play a critical role in maximizing returns by securing positions within these "warranty channels."
1. Trend-Following
The market's complexity, influenced by countless factors, makes small movements seem almost chaotic. Yet, the principle of #Trend-Following shines in less volatile markets in long term. The strategy excels by pinpointing the ideal moments to enter the market, coupled with refined risk management to secure profits. It’s tailored for you, the individual trader, enabling you to ride the waves of market trends upwards or downwards.
2. Risk Management
A key facet of the strategy is its emphasis on pragmatic risk management. Traders are empowered to establish practical stop-loss and take-profit levels, tailoring these crucial parameters to the specific market they are engaging in. This customization is instrumental in optimizing long-term profitability, ensuring that the strategy adapts fluidly to the unique characteristics and volatility patterns of different trading environments.
V) Strategy's Input Settings and Default Values
1. Alerts
The strategy comes equipped with a flexible alert system designed to keep you informed and ready to act. Within the settings, you’ll find options to configure order/exit and comment/alert messages to your preference. This feature is particularly useful for staying on top of the strategy’s activities without constant manual oversight.
2. Hull Suite
i. Hull Suite Length: Designed for capturing long-term trends, the Hull Suite Length is configured at 1000. Functioning comparably to moving averages, the Hull Suite features upper and lower bands. Currently, it is set to 1000.
ii. Length Multiplier: It's advisable to maintain a minimal value for the Length Multiplier, prioritizing the optimization of the Hull Suite Length. Presently, it is set to 1.
3. RSI Indicator
i. The RSI is a widely recognized tool in trading. Adapt the oversold and overbought thresholds to better match the specifics of your market for optimal results.
4. StopLoss and TakeProfit
i. StopLoss and TakeProfit Settings: Two distinct approaches are available. Semi-Automatic StopLoss/TakeProfit Setting and Manual StopLoss/TakeProfit Setting. The Semi-Automatic mode streamlines the process by allowing you to input values for a 5-minute timeframe, subsequently auto-adjusting these values across various timeframes, both lower and higher. Conversely, the Manual mode offers full control, enabling you to meticulously define TakeProfit values for each individual timeframe.
ii. TakeProfit Threshold # and TakeProfit Value #: Imagine this mechanism as an ascending staircase. Each step represents a range, with the lower boundary (TakeProfit Value) designed to close the trade upon being reached, and the upper boundary (TakeProfit Threshold) upon being hit, propelling the trade to the next level, and forming a new range. This stair-stepping approach enhances risk management and increases profitability. The pre-set configurations are tailored for $BINANCE:BTCUSDT. It's advisable to devote time to tailoring these settings to your specific market, aiming to achieve optimal results based on backtesting.
iii. StopLoss Value: In line with its name, this value marks the limit of loss you're prepared to accept should the market trend go against your expectations. It's crucial to note that once your asset reaches the first TakeProfit range, the initial StopLoss value becomes obsolete, supplanted by the first TakeProfit Value. The default StopLoss value is pegged at 1.6(%), a figure worth considering in your trading strategy.
VI) Entry Conditions
The primary signal for entry is generated by our custom trend detection mechanism and hull suite values (ascending/descending). This is supported by additional indicators acting as confirmation.
VII) Exit Conditions
The strategy stipulates exit conditions primarily governed by stop loss and take profit parameters. On infrequent occasions, if the trend lacks confirmation post-entry, the strategy mandates an exit upon the issuance of a reverse signal (whether confirmed or unconfirmed) by the strategy itself.
BITsPIP

Brilliance Academy Secret StrategyThe Brilliance Academy Secret Strategy is a powerful trading strategy designed to identify potential trend reversals and optimize entry and exit points in the market. This strategy incorporates a combination of technical indicators, including Moving Average Convergence Divergence (MACD), Relative Strength Index (RSI), Pivot Points, and Bollinger Bands.
Key Features:
MACD Indicator: A momentum oscillator that helps identify changes in trend strength and direction.
RSI Indicator: A momentum oscillator that measures the speed and change of price movements, indicating potential overbought or oversold conditions.
Pivot Points: Key levels used by traders to identify potential support and resistance levels in the market, aiding in trend reversal identification.
Bollinger Bands: Volatility bands placed above and below a moving average, indicating potential market volatility and overbought or oversold conditions.
How to Use:
Long Signals: Look for long signals when the market price is above the 200-period moving average, MACD line crosses below the signal line, RSI is above 30, and price is above the lower Bollinger Band or at a pivot low.
Short Signals: Look for short signals when the market price is below the 200-period moving average, MACD line crosses above the signal line, RSI is below 70, and price is below the upper Bollinger Band or at a pivot high.
Exit Strategy: Long trades are closed when the next short signal occurs or when the profit reaches a fixed take profit percentage (3% above entry price). Short trades are closed when the next long signal occurs or when the profit reaches a fixed take profit percentage (3% below entry price).

Universal Algorithm [BackQuant]Universal Algorithm
It is a trading strategy designed CLEAR TREND DETECTION . This script is the culmination of extensive research and development efforts aimed at providing traders with a robust tool capable of adapting to a wide array of market conditions. This description delves into the core components, methodologies, and operational parameters of Universal Algo to offer potential users a clear understanding of its functionalities and the principles underpinning its design.
Core Methodologies and Features:
Integrated Systems: Universal Algo is built around six core systems, each contributing unique analytical perspectives to enhance trade signal reliability. These systems are designed to identify clear trend opportunities for significant gains, while also employing logic to navigate through ranging markets effectively.
Adaptive Market Logic: By incorporating volatility metrics, the algorithm dynamically adjusts to changing market conditions. This ensures that the strategy remains effective across different market regimes, aiming to reduce market noise and improve signal quality.
Selective Shorting Mechanism: While the primary focus is on capturing long positions, it includes an optional shorting feature. This can be activated by users to adapt the strategy during macro downtrends, thus providing a flexible approach to market participation.
Backtesting and Forward-Testing Rigor : The strategy has undergone rigorous testing to validate its performance and reliability. It demonstrates prudent risk management by optimizing conditions under which short positions are considered, aiming to mitigate drawdowns and preserve capital.
Operational Parameters:
Customization Options: The script offers a range of user inputs, allowing for customization of the backtesting starting date, the decision to display the strategy equity curve, among other settings. These inputs cater to diverse trading needs and preferences, offering users control over their strategy implementation.
Transparency and Logic Insight: While specific calculation details and proprietary indicators are integral to maintaining the uniqueness of Universal Algo , the strategy is grounded on well-established financial analysis techniques. These include momentum analysis, volatility assessments, and adaptive thresholding, among others, to formulate its trade signals.
Realistic Trading Conditions : Backtesting, considered realistic trading conditions, including appropriate account size, commission, slippage, and sustainable risk levels per trade. The strategy is designed and tested with a focus on achieving a balance between risk and reward, striving for robustness and reliability rather than unrealistic profitability promises.
Concluding Thoughts:
Universal Algo is offered to the TradingView community as a tool for traders seeking to enhance their market analysis and trading strategies. Its development is driven by a commitment to quality, innovation, and adaptability, aiming to provide valuable insights and decision-support in various market conditions. Potential users are encouraged to evaluate Universal Algo within the context of their overall trading approach and objectives.

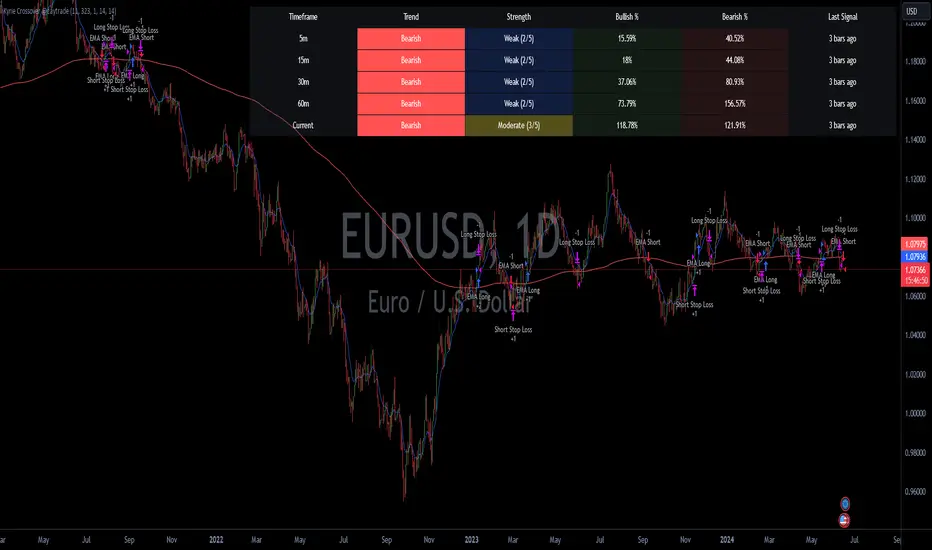
Kyrie Crossover ( @zaytradellc )Unlocking Market Dynamics: Kyrie Crossover Script by @zaytradellc
personalized trading success with the "Kyrie Crossover" script, meticulously crafted by @zaytrade. This innovative Pine Script, tailored to the birthdays of Kyrie and the script creator, combines the power of technical analysis with a touch of personalization to revolutionize your trading experience.
**Exponential Moving Average (EMA) Crossover Strategy:**
At the heart of the "Kyrie Crossover" script lies a sophisticated EMA crossover strategy. By utilizing a 10-period EMA and a 323-period EMA (symbolizing long term price action ), the strategy effectively captures market trends with precision and insight.
- **Short-Term EMA (10-period):** This EMA reacts swiftly to recent price changes, offering heightened sensitivity to short-term fluctuations. It excels in identifying immediate shifts in market sentiment, making it invaluable for pinpointing short-lived trends and potential reversal points.
- **Long-Term EMA (323-period):** In contrast, the long-term EMA provides a broader perspective by smoothing out short-term noise and focusing on longer-term trend direction. Its extended length filters out market noise effectively, providing a clear representation of the underlying trend's momentum and sustainability.
**Directional Movement Index (DMI) Metrics:**
The "Kyrie Crossover" script goes beyond traditional indicators by incorporating DMI metrics across multiple timeframes. By assessing trend strength and direction, traders gain valuable insights into market dynamics, allowing for informed decision-making.
**Simple Instructions to Profit:**
1. **Identify EMA Crossovers:** Look for instances where the short-term EMA (10-period) crosses above the long-term EMA (323-period) for a bullish signal, indicating a potential buying opportunity. Conversely, a crossover where the short-term EMA crosses below the long-term EMA signals a bearish trend and a potential selling opportunity.
2. **Confirm with DMI Metrics:** Validate EMA crossovers by checking DMI metrics across different timeframes (5 minutes, 15 minutes, 30 minutes, and 1 hour). Pay attention to color-coded indicators, with green indicating a bullish trend, red indicating a bearish trend, and white indicating no clear trend.
3. **Manage Risk:** Implement proper risk management techniques, such as setting stop-loss orders and position sizing based on your risk tolerance and trading objectives.
4. **Stay Informed:** Regularly monitor market conditions and adjust your trading strategy accordingly based on new signals and emerging trends.
Bitcoin Momentum StrategyThis is a very simple long-only strategy I've used since December 2022 to manage my Bitcoin position.
I'm sharing it as an open-source script for other traders to learn from the code and adapt it to their liking if they find the system concept interesting.
General Overview
Always do your own research and backtesting - this script is not intended to be traded blindly (no script should be) and I've done limited testing on other markets beyond Ethereum and BTC, it's just a template to tweak and play with and make into one's own.
The results shown in the strategy tester are from Bitcoin's inception so as to get a large sample size of trades, and potential returns have diminished significantly as BTC has grown to become a mega cap asset, but the script includes a date filter for backtesting and it has still performed solidly in recent years (speaking from personal experience using it myself - DYOR with the date filter).
The main advantage of this system in my opinion is in limiting the max drawdown significantly versus buy & hodl. Theoretically much better returns can be made by just holding, but that's also a good way to lose 70%+ of your capital in the inevitable bear markets (also speaking from experience).
In saying all of that, the future is fundamentally unknowable and past results in no way guarantee future performance.
System Concept:
Capture as much Bitcoin upside volatility as possible while side-stepping downside volatility as quickly as possible.
The system uses a simple but clever momentum-style trailing stop technique I learned from one of my trading mentors who uses this approach on momentum/trend-following stock market systems.
Basically, the system "ratchets" up the stop-loss to be much tighter during high bearish volatility to protect open profits from downside moves, but loosens the stop loss during sustained bullish momentum to let the position ride.
It is invested most of the time, unless BTC is trading below its 20-week EMA in which case it stays in cash/USDT to avoid holding through bear markets. It only trades one position (no pyramiding) and does not trade short, but can easily be tweaked to do whatever you like if you know what you're doing in Pine.
Default parameters:
HTF: Weekly Chart
EMA: 20-Period
ATR: 5-period
Bar Lookback: 7
Entry Rule #1:
Bitcoin's current price must be trading above its higher-timeframe EMA (Weekly 20 EMA).
Entry Rule #2:
Bitcoin must not be in 'caution' condition (no large bearish volatility swings recently).
Enter at next bar's open if conditions are met and we are not already involved in a trade.
"Caution" Condition:
Defined as true if BTC's recent 7-bar swing high minus current bar's low is > 1.5x ATR, or Daily close < Daily 20-EMA.
Trailing Stop:
Stop is trailed 1 ATR from recent swing high, or 20% of ATR if in caution condition (ie. 0.2 ATR).
Exit on next bar open upon a close below stop loss.
I typically use a limit order to open & exit trades as close to the open price as possible to reduce slippage, but the strategy script uses market orders.
I've never had any issues getting filled on limit orders close to the market price with BTC on the Daily timeframe, but if the exchange has relatively low slippage I've found market orders work fine too without much impact on the results particularly since BTC has consistently remained above $20k and highly liquid.
Cost of Trading:
The script uses no leverage and a default total round-trip commission of 0.3% which is what I pay on my exchange based on their tier structure, but this can vary widely from exchange to exchange and higher commission fees will have a significantly negative impact on realized gains so make sure to always input the correct theoretical commission cost when backtesting any script.
Static slippage is difficult to estimate in the strategy tester given the wide range of prices & liquidity BTC has experienced over the years and it largely depends on position size, I set it to 150 points per buy or sell as BTC is currently very liquid on the exchange I trade and I use limit orders where possible to enter/exit positions as close as possible to the market's open price as it significantly limits my slippage.
But again, this can vary a lot from exchange to exchange (for better or worse) and if BTC volatility is high at the time of execution this can have a negative impact on slippage and therefore real performance, so make sure to adjust it according to your exchange's tendencies.
Tax considerations should also be made based on short-term trade frequency if crypto profits are treated as a CGT event in your region.
Summary:
A simple, but effective and fairly robust system that achieves the goals I set for it.
From my preliminary testing it appears it may also work on altcoins but it might need a bit of tweaking/loosening with the trailing stop distance as the default parameters are designed to work with Bitcoin which obviously behaves very differently to smaller cap assets.
Good luck out there!

INFINITY ALGO🆕Meet the updated version of our flagship indicator, now it's INFINITY ALGO!
🏃🏻 QUICK START
In very simple terms, our indicator generates complex trading signals on your chart (buy/sell), including Entry Point, Take Profit levels, Stop Loss level
To start, you need to add our indicator to your chart , choose a timeframe (we recommend 13min,15min and 4h but you can try any, these only have the best results) and set up notifications (how to do it told below) and that's it, you can work with it even without changing the settings!
Of course, to improve the accuracy of signals you will have to choose the optimal settings of the script for each trading pair and timeframe (you can find a guide below)
📊 SIGNALS
This script will generate complex trading recommendations, both Long and Short (signals); signals include:
- Entry Point:
Calculated based on pivot levels with confirmation by EMA/SMA (you can select this in the settings); also bullish/bearish cup is checked to confirm the entry.
Additionally, in the settings you can enable Heiken Ashi calculation mode (it shows much better on some trading pairs).
Why do we mashup these components and how they work together?
- The main indicator in our script is pivot levels, it is enabled by default and cannot be disabled. Auxiliary indicators (which you can switch on and off in the script settings) are EMA/SMA and Heiken Ashi. We have used pivot levels, which mark potential support and resistance zones based on previous price action. We have also used EMA/SMA that smooth out price fluctuations and show the direction of the trend. We have added an option to use Heiken Ashi that filters out noise and highlights the trend. We have also checked for bullish/bearish cup patterns, which are reversal patterns that indicate a change in momentum. By combining these indicators, we have created a more robust entry point that considers multiple factors such as price levels, trend, noise, and momentum.
- 6 Take Profit levels:
It is also possible to change in the settings (It is also possible to change the values for Short or Long positions separately), it will be fixed values in % (The default Take Profits for Long&Short are as follows: TP1-0.3%; TP2-1%; TP3-2%; TP4-3%; TP5-7.5%; TP6-16.5%)
- Stop Loss Level:
As with Take Profits, this is a fixed % value that you can customise to suit your risk management needs (It is also possible to change the values for Short or Long positions separately, by default is 4.5% for Long&Short positions)
*When trading on these signals, we strongly recommend that you exit the position in parts at each take profit or close your entire position at one particular take profit. Our script was designed specifically for exiting a position on take profits
⚙️ SETTINGS
Now let's talk about the settings of this script, which allow you to customise the signals quite a lot. In general, we recommend selecting the settings for each trading pair and timeframe separately, this will allow you to achieve better targets accuracy (the default settings are universal, you can trade with them without changing them if you want)
-> IMAGE <-
1. Period - minimum value of 2. Increasing this parameter will increase the accuracy of signals, but will reduce their number (accordingly, lowering the parameter will do the opposite). For the majority of trading pairs and timeframes the optimal period will be between 5 and 10 (the default value is 5).
2. Maximum Breakout length (in bars) - for most trading pairs you can set the value from 200 to 300 and it will be optimal. Below 200 is not recommended
3. T hreshold Rate % - this value also affects the accuracy and the number of signals - the higher this value is, the more often signals will be generated, but it can negatively affect the accuracy. The minimum value is 3, and the maximum value is 10. We recommend to try values in the range from 4 to 7 for most tickers
4. Minimum Number of tests - the number of level checks is required, we recommend to try 2, and only for some timeframes increase to 3
5. MA type & MA filter - The shorter the length of moving averages, the faster they react to trend changes, and show more local trends than global ones. If the length of MAs is longer, more global trends are shown. By default, the most optimal values are set.
By the way, you can ask us for a ready-made preset for any pair and we will be happy to help you!
📄 BACKTESTING
Now let's talk about how to properly test the settings and evaluate their effectiveness. Our script has a c ustom built-in backtester that shows statistics on the current trading pair and allows you to calculate the accuracy of each take profit target, as well as calculate values such as Gross profit/loss, net profit, and the ratio of initial deposit to profit. (you can enable/disable backtester "statistics" label in main settings)
In the main settings you can change the values for: initial deposit (Deposit $), trade size $ and leverage (by the way, it also affects the display of the label "Peak profit", which is calculated with this leverage)
-> IMAGE <-
Now let's look at the backtester - it shows detailed statistics for each Take Profit level, including: accuracy in % and number of trades; gross profit & loss; net profit in % and $ (based on selected settings); deposit to profit ratio in % and $.
Why did we choose such properties in the backtest for publication?
- Well, as the initial capital we took 5000$ and deposit 3% (150$) of the initial capital in each trade. For the fee was taken the value from the exchange Binance, which is 0.06% per trade (Taker + Maker, for a user without VIP on Binance and without taking into account additional fees such as funding, leverage fees, etc).
- Please also take a look at our inbuilt backtester ( IMAGE ) which counts the accuracy to each Take Profit. Also note that our inbuilt backtester does not take any fees into account. Pay attention to the last field "Deposit with Profit" it shows the value if you would close all positions at a certain target. For example, we can see that the most optimal is TP3 at these settings for this trading pair and timeframe, as the deposit to profit ratio will be +61.2%
- Also the script is more designed for swing and long term trading, so on most trading pairs you will be able to see statistics for 60-90 trades dataset
*disclaimer: please note that past results does not guarantee future performance! The accuracy of take profit targets in our backtester is calculated on past results, keep this in mind please
📥 NOTIFICATIONS
We have provided notifications that will deliver the latest signals to you in a convenient format in TradingView. The notification looks like this: It contains the entry point, Take Profits, Stop Loss, and a bit of advice on risk management. -> IMAGE <-
To set up notifications:
1. Select the script settings, trading pair and timeframe
2. Click "add alert on InfinityAlgo", then select "alert () function calls only" in the settings
-> IMAGE <-
3. That's it, now all that's left is to wait for a fresh alert
🔑 HOW TO GET ACCESS
We hope you will like this script :) We are always ready to help you with customisation, just let us know! To learn more about our scripts & get access - check out the “Author’s instructions” below 👇🏼

Trend Deviation strategy - BTC [IkkeOmar]Intro:
This is an example if anyone needs a push to get started with making strategies in pine script. This is an example on BTC, obviously it isn't a good strategy, and I wouldn't share my own good strategies because of alpha decay.
This strategy integrates several technical indicators to determine market trends and potential trade setups. These indicators include:
Directional Movement Index (DMI)
Bollinger Bands (BB)
Schaff Trend Cycle (STC)
Moving Average Convergence Divergence (MACD)
Momentum Indicator
Aroon Indicator
Supertrend Indicator
Relative Strength Index (RSI)
Exponential Moving Average (EMA)
Volume Weighted Average Price (VWAP)
It's crucial for you guys to understand the strengths and weaknesses of each indicator and identify synergies between them to improve the strategy's effectiveness.
Indicator Settings:
DMI (Directional Movement Index):
Length: This parameter determines the number of bars used in calculating the DMI. A higher length may provide smoother results but might lag behind the actual price action.
Bollinger Bands:
Length: This parameter specifies the number of bars used to calculate the moving average for the Bollinger Bands. A longer length results in a smoother average but might lag behind the price action.
Multiplier: The multiplier determines the width of the Bollinger Bands. It scales the standard deviation of the price data. A higher multiplier leads to wider bands, indicating increased volatility, while a lower multiplier results in narrower bands, suggesting decreased volatility.
Schaff Trend Cycle (STC):
Length: This parameter defines the length of the STC calculation. A longer length may result in smoother but slower-moving signals.
Fast Length: Specifies the length of the fast moving average component in the STC calculation.
Slow Length: Specifies the length of the slow moving average component in the STC calculation.
MACD (Moving Average Convergence Divergence):
Fast Length: Determines the number of bars used to calculate the fast EMA (Exponential Moving Average) in the MACD.
Slow Length: Specifies the number of bars used to calculate the slow EMA in the MACD.
Signal Length: Defines the number of bars used to calculate the signal line, which is typically an EMA of the MACD line.
Momentum Indicator:
Length: This parameter sets the number of bars over which momentum is calculated. A longer length may provide smoother momentum readings but might lag behind significant price changes.
Aroon Indicator:
Length: Specifies the number of bars over which the Aroon indicator calculates its values. A longer length may result in smoother Aroon readings but might lag behind significant market movements.
Supertrend Indicator:
Trendline Length: Determines the length of the period used in the Supertrend calculation. A longer length results in a smoother trendline but might lag behind recent price changes.
Trendline Factor: Specifies the multiplier used in calculating the trendline. It affects the sensitivity of the indicator to price changes.
RSI (Relative Strength Index):
Length: This parameter sets the number of bars over which RSI calculates its values. A longer length may result in smoother RSI readings but might lag behind significant price changes.
EMA (Exponential Moving Average):
Fast EMA: Specifies the number of bars used to calculate the fast EMA. A shorter period results in a more responsive EMA to recent price changes.
Slow EMA: Determines the number of bars used to calculate the slow EMA. A longer period results in a smoother EMA but might lag behind recent price changes.
VWAP (Volume Weighted Average Price):
Default settings are typically used for VWAP calculations, which consider the volume traded at each price level over a specific period. This indicator provides insights into the average price weighted by trading volume.
backtest range and rules:
You can specify the start date for backtesting purposes.
You can can select the desired trade direction: Long, Short, or Both.
Entry and Exit Conditions:
LONG:
DMI Cross Up: The Directional Movement Index (DMI) indicates a bullish trend when the positive directional movement (+DI) crosses above the negative directional movement (-DI).
Bollinger Bands (BB): The price is below the upper Bollinger Band, indicating a potential reversal from the upper band.
Momentum Indicator: Momentum is positive, suggesting increasing buying pressure.
MACD (Moving Average Convergence Divergence): The MACD line is above the signal line, indicating bullish momentum.
Supertrend Indicator: The Supertrend indicator signals an uptrend.
Schaff Trend Cycle (STC): The STC indicates a bullish trend.
Aroon Indicator: The Aroon indicator signals a bullish trend or crossover.
When all these conditions are met simultaneously, the strategy considers it a favorable opportunity to enter a long trade.
SHORT:
DMI Cross Down: The Directional Movement Index (DMI) indicates a bearish trend when the negative directional movement (-DI) crosses above the positive directional movement (+DI).
Bollinger Bands (BB): The price is above the lower Bollinger Band, suggesting a potential reversal from the lower band.
Momentum Indicator: Momentum is negative, indicating increasing selling pressure.
MACD (Moving Average Convergence Divergence): The MACD line is below the signal line, signaling bearish momentum.
Supertrend Indicator: The Supertrend indicator signals a downtrend.
Schaff Trend Cycle (STC): The STC indicates a bearish trend.
Aroon Indicator: The Aroon indicator signals a bearish trend or crossover.
When all these conditions align, the strategy considers it an opportune moment to enter a short trade.
Disclaimer:
THIS ISN'T AN OPTIMAL STRATEGY AT ALL! It was just an old project from when I started learning pine script!
The backtest doesn't promise the same results in the future, always do both in-sample and out-of-sample testing when backtesting a strategy. And make sure you forward test it as well before implementing it!
Furthermore this strategy uses both trend and mean-reversion systems, that is usually a no-go if you want to build robust trend systems .
Don't hesitate to comment if you have any questions or if you have some good notes for a beginner.

Long EMA Strategy with Advanced Exit OptionsThis strategy is designed for traders seeking a trend-following system with a focus on precision and adaptability.
**Core Strategy Concept**
The essence of this strategy lies in use of Exponential Moving Averages (EMAs) to identify potential long (buy) positions based on the relative positions of short-term, medium-term, and long-term EMAs. The use of EMAs is a classic yet powerful approach to trend detection, as these indicators smooth out price data over time, emphasizing the direction of recent price movements and potentially signaling the beginning of new trends.
**Customizable Parameters**
- **EMA Periods**: Users can define the periods for three EMAs - long-term, medium-term, and short-term - allowing for a tailored approach to capture trends based on individual trading styles and market conditions.
- **Volatility Filter**: An optional Average True Range (ATR)-based volatility filter can be toggled on or off. When activated, it ensures that trades are only entered when market volatility exceeds a user-defined threshold, aiming to filter out entries during low-volatility periods which are often characterized by indecisive market movements.
- **Trailing Stop Loss**: A trailing stop loss mechanism, expressed as a percentage of the highest price achieved since entry, provides a dynamic way to manage risk by allowing profits to run while cutting losses.
- **EMA Exit Condition**: This advanced exit option enables closing positions when the short-term EMA crosses below the medium-term EMA, serving as a signal that the immediate trend may be reversing.
- **Close Below EMA Exit**: An additional exit condition, which is disabled by default, allows positions to be closed if the price closes below a user-selected EMA. This provides an extra layer of flexibility and risk management, catering to traders who prefer to exit positions based on specific EMA thresholds.
**Operational Mechanics**
Upon activation, the strategy evaluates the current price in relation to the set EMAs. A long position is considered when the current price is above the long-term EMA, and the short-term EMA is above the medium-term EMA. This setup aims to identify moments where the price momentum is strong and likely to continue.
The strategy's versatility is further enhanced by its optional settings:
- The **Volatility Filter** adjusts the sensitivity of the strategy to market movements, potentially improving the quality of the entries during volatile market conditions.
The Average True Range (ATR) is a key component of this filter, providing a measure of market volatility by calculating the average range between the high and low prices over a specified number of periods. Here's how you can adjust the volatility filter settings for various market conditions, focusing on filtering out low-volatility markets:
Setting Examples for Volatility Filter
1. High Volatility Markets (e.g., Cryptocurrencies, Certain Forex Pairs):
ATR Periods: 14 (default)
ATR Multiplier: Setting the multiplier to a lower value, such as 1.0 or 1.2, can be beneficial in high-volatility markets. This sensitivity allows the strategy to react to volatility changes more quickly, ensuring that you're entering trades during periods of significant movement.
2. Medium Volatility Markets (e.g., Major Equity Indices, Medium-Volatility Forex Pairs):
ATR Periods: 14 (default)
ATR Multiplier: A multiplier of 1.5 (default) is often suitable for medium volatility markets. It provides a balanced approach, ensuring that the strategy filters out low-volatility conditions without being overly restrictive.
3. Low Volatility Markets (e.g., Some Commodities, Low-Volatility Forex Pairs):
ATR Periods: Increasing the ATR period to 20 or 25 can smooth out the volatility measure, making it less sensitive to short-term fluctuations. This adjustment helps in focusing on more significant trends in inherently stable markets.
ATR Multiplier: Raising the multiplier to 2.0 or even 2.5 increases the threshold for volatility, effectively filtering out low-volatility conditions. This setting ensures that the strategy only triggers trades during periods of relatively higher volatility, which are more likely to result in significant price movements.
How to Use the Volatility Filter for Low-Volatility Markets
For traders specifically interested in filtering out low-volatility markets, the key is to adjust the ATR Multiplier to a higher level. This adjustment increases the threshold required for the market to be considered sufficiently volatile for trade entries. Here's a step-by-step guide:
Adjust the ATR Multiplier: Increase the ATR Multiplier to create a higher volatility threshold. A multiplier of 2.0 to 2.5 is a good starting point for very low-volatility markets.
Fine-Tune the ATR Periods: Consider lengthening the ATR calculation period if you find that the strategy is still entering trades in undesirable low-volatility conditions. A longer period provides a more averaged-out measure of volatility, which might better suit your needs.
Monitor and Adjust: Volatility is not static, and market conditions can change. Regularly review the performance of your strategy in the context of current market volatility and adjust the settings as necessary.
Backtest in Different Conditions: Before applying the strategy live, backtest it across different market conditions with your adjusted settings. This process helps ensure that your approach to filtering low-volatility conditions aligns with your trading objectives and risk tolerance.
By fine-tuning the volatility filter settings according to the specific characteristics of the market you're trading in, you can enhance the performance of this strategy
- The **Trailing Stop Loss** and **EMA Exit Conditions** provide two layers of exit strategies, focusing on capital preservation and profit maximization.
**Visualizations**
For clarity and ease of use, the strategy plots the three EMAs and, if enabled, the ATR threshold on the chart. These visual cues not only aid in decision-making but also help in understanding the market's current trend and volatility state.
**How to Use**
Traders can customize the EMA periods to fit their trading horizon, be it short, medium, or long-term trading. The volatility filter and exit options allow for further customization, making the strategy adaptable to different market conditions and personal risk tolerance levels.
By offering a blend of trend-following principles with advanced risk management features, this strategy aims to cater to a wide range of trading styles, from cautious to aggressive. Its strength lies in its flexibility, allowing traders to fine-tune settings to their specific needs, making it a potentially valuable tool in the arsenal of any trader looking for a disciplined approach to navigating the markets.

Triple MA HTF strategy - Dynamic SmoothingThe triple MA strategy is a simple but effective method to trade the trend. The advantage of this script over the existing triple MA strategies is that the user can open a lower time frame chart and select higher time frame inputs for different MA types mainting the visibility on the chart. The dynamic smoothing code makes sure the HTF trendlines are not jagged, but a fluid line visiable on the lower time frame chart. The script comes with a MA crossover and crossunder strategy explained below.
Moving Averages (MA) Crossover for Entry:
Long Entry: A long entry signal is triggered when the moving average line 1 crosses above the moving average line 2. This crossover indicates a potential shift in market sentiment towards the upside. However, to validate this signal, the strategy checks if the moving average 3 on a higher time frame (eg. 4 hour) is in an upward trend. This additional filter ensures that the trade aligns with the prevailing trend on a broader time scale, increasing the probability of success.
Short Entry: Conversely, a short entry signal occurs when the moving average line 1 crosses below the moving average line 2. This crossover suggests a possible downturn in market momentum. However, for a short trade to be confirmed, the strategy verifies that the moving average 3 on the higher time frame is in a downward trend. This confirmation ensures that the trade is in harmony with the overarching market direction.
Exit from Long Position: The strategy triggers an exit signal from a long position when the moving average line 1 crosses below the moving average line 2. This crossover indicates a potential reversal in the market trend, prompting the trader to close their long position and take profits or minimize losses.
Exit from Short Position: Similarly, an exit signal from a short position occurs when the moving average line 1 crosses above the moving average line 2. This crossover suggests a potential shift in market sentiment towards the upside, prompting the trader to exit their short position and manage their risk accordingly.
Features of the script
This Triple MA Strategy is basically the HTF Trend Filter displayed 3 times on the chart. For more infomation on how the MA with dynamic smoothing is calculated I recommend reading the following script:
For risk management I included a simple script to opt for % of eauity or # of contracts of in the instrument. For explanation on how the risk management settings work I refer to my ealier published script:
The strategy is a simplified example for setting up an entry and exit logic based on multiple moving avarages. Hence the script is meant for educational purposes only.
