MilleMachineHello traders,
I hereby present to you the second stage of my journey to finding a reliable, profitable trading strategy.
The "Millemachine" is based on the "Millebot", my previous published strategy. This means the backbone of the strategy is still the same: a trend following system. Instead of using a fixed TP and SL, a trailing stoploss is now used. To limit the losses when the trend weakens, the trailing stoploss automatically gets smaller, as it is based on the ATR.
A new utility is you can now easily switch between indicators on which the decision making is based. This allows the user to discover which indicators work best for entry, long/short switching and stoploss configuration.
The strategy has been proven to be very profitable in trending markets, but can suffer losses during ranging market. To make the system more robust, the strategy cannot solely rely on a trending system. Other systems must be added.
I believe that a good trading bot must consist of more than 4 different strategies, based on different systems. This is what I am currently working on.
My goal for publishing this strategy is to help other traders build their own. In my journey I found it difficult to find a good strategy that employs a decent risk management, which is truly essential for having good, consistent results. Also, a realistic commission needs to be defined to have a realistic performance prediction. This weighs on the profitability and therefore is often set at 0 by authors of other strategies, which I find misleading.
If you have found this strategy informative or useful, please leave a comment.
Greetings Michael
ממוצעים נעים

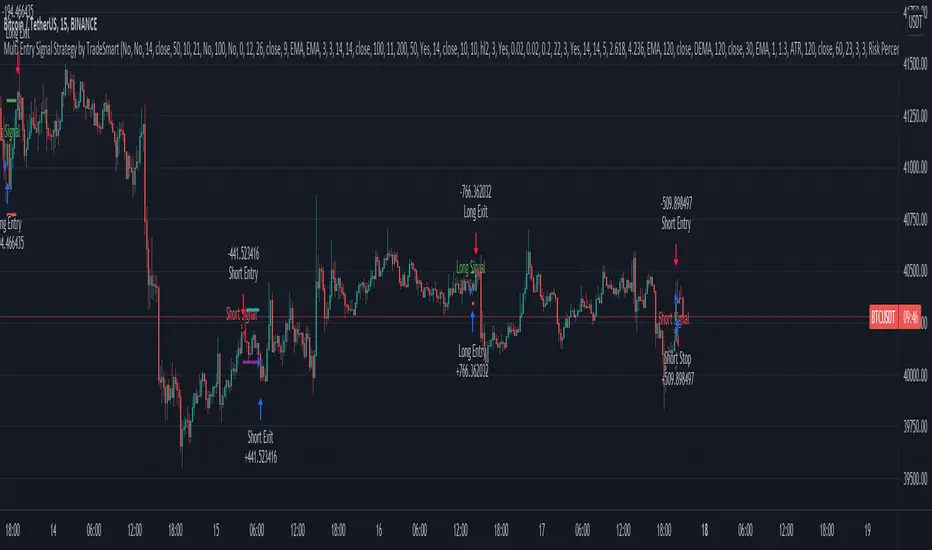
Multi Entry Signal Strategy by TradeSmartThis strategy is intended to test different entry signals. You can use 13 different entry signals in the strategy.
Available signals with all their settings:
Heikin Ashi
RSI + EMA
Wavetrend
MACD
Stochastic RSI
Squeeze Momentum
Kairi Relative Index
SSL
Supertrend
Parabolic SAR
Chandelier Exit
Directional Movement Index
Quantitative Qualitative Estimation
For exact rules of entries please relate to the tooltips of each entry signal. All the signals can be used together or separately in the strategy.
Additional settings that can be used:
Trend Filter (limit long or short entries based on a moving average of your choice)
Exit Strategy settings (ATR is used to determine stop loss and take profit levels)
Trailing Loss Setups (you can use 3 different types of trailing losses)
Setups (you can set Long and Short entries as well as the order size based on either Capital % or Risk %)
Date Range (you can limit trades to specific date ranges)
Trading Time (you can limit on which days to trade)
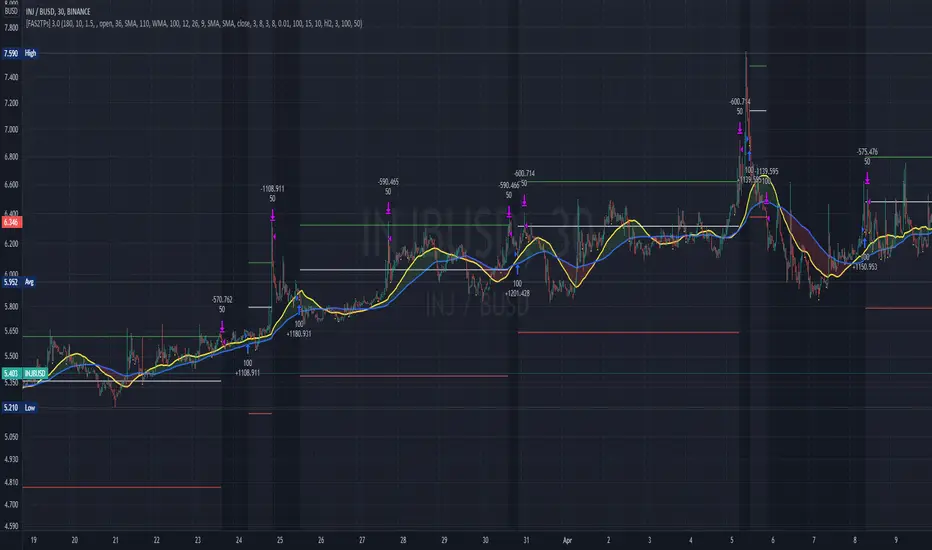
[Fedra Algotrading 2TPs]This strategy uses the deviation of a simple linear regression to determine the entry point into a short-term trend. It also includes an intelligent trend filter (SMA, WMA, Super trend and MACD), to determine the dominant trend over a longer time frame and avoid opening trades against the market.
It manages capital by dividing the position into 2 take profits, the first one configurable in a fixed percentage, which will sell half of the position, and the second one that will trigger a trailing take profit once the desired percentage is reached, with the rest of the position.
Each parameter is optimizable to adapt it to the desired market, but this strategy benefits from the high volatility of mid and low capitalization cryptocurrencies due to their higher volatility.
It also includes tools to adjust the backtests, and command inputs so that the script can automatically work with bots.
HARSI - The WHALE v2This strategy is credited to the "Heikin Ashi RSI Oscillator" By JayRogers.
The core of this strategy is "Heikin Ashi RSI Oscillator (HARSI)" By JayRogers, with multiple confirmation indicators. The buy signal is generated by HARSI when there is green HA, and there is a positive stochastic cross under the line OB line.
To confirm the buys signal, you can use one or all of the following:
- EMA: the buy confirmation is positive if the candle closes above the EMA.
- Volume Oscillator: the buy confirmation is positive if the volume value is above the zero line.
- ADX: the buy confirmation is positive if the D+ is above the D- and the D+ is above the threshold level.
- Vortex: the buy confirmation is positive if VI+ is above VI-.
You can enable the take profit, trailing stop loss (TSL), and stop lose (SL), if not, then the strategy will give a sell signal by itself when there is a negative stochastic cross above OB Extreme line.
Note, that the TSL arming value should be lower than the TSL %.
The strategy can give a different result based on your selection. However, the best timeframe is 4 hours without TP.

Combo 2/20 EMA & (H-L)/C Histogram This is combo strategies for get a cumulative signal.
First strategy
This indicator plots 2/20 exponential moving average. For the Mov
Avg X 2/20 Indicator, the EMA bar will be painted when the Alert criteria is met.
Second strategy
This histogram displays (high-low)/close
Can be applied to any time frame.
WARNING:
- For purpose educate only
- This script to change bars colors.
Combo 2/20 EMA & Bandpass Filter This is combo strategies for get a cumulative signal.
First strategy
This indicator plots 2/20 exponential moving average. For the Mov
Avg X 2/20 Indicator, the EMA bar will be painted when the Alert criteria is met.
Second strategy
The related article is copyrighted material from
Stocks & Commodities Mar 2010
WARNING:
- For purpose educate only
- This script to change bars colors.
Combo 2/20 EMA & Average True Range Reversed This is combo strategies for get a cumulative signal.
First strategy
This indicator plots 2/20 exponential moving average. For the Mov
Avg X 2/20 Indicator, the EMA bar will be painted when the Alert criteria is met.
Second strategy
Average True Range Trailing Stops Strategy, by Sylvain Vervoort
The related article is copyrighted material from Stocks & Commodities Jun 2009
Please, use it only for learning or paper trading. Do not for real trading.
WARNING:
- For purpose educate only
- This script to change bars colors.
TICK Scalping strategy, SPY 1 min1 min chart scalping version of my other TICK strategy with adjusted parameters and additional entry and exit conditions better suited for 1 min SPY chart. Please refer to my original TICK strategy for explanation.
Important notes:
1. This strategy is designed for same day SPY option scalping on the 1 min chart . All profit shown in back testing report is based on Profit/Loss (P/L) estimates from trading options with approximately 6 weeks of data. By default, it is set to 10 option contracts. By default the initial capital is set to $5000. Pyramiding is set to 3.
2. This strategy works better with non-extended market data .
3. This strategy is mainly developed for SPY trading on 1 min chart, it probably will not be very profitable with other tickers or time frame without tweaking all the parameters first.
Cheers and enjoy~! Let's all make money~!!

Combo 2/20 EMA & ADXR This is combo strategies for get a cumulative signal.
First strategy
This indicator plots 2/20 exponential moving average. For the Mov
Avg X 2/20 Indicator, the EMA bar will be painted when the Alert criteria is met.
Second strategy
The Average Directional Movement Index Rating (ADXR) measures the strength
of the Average Directional Movement Index (ADX). It's calculated by taking
the average of the current ADX and the ADX from one time period before
(time periods can vary, but the most typical period used is 14 days).
Like the ADX, the ADXR ranges from values of 0 to 100 and reflects strengthening
and weakening trends. However, because it represents an average of ADX, values
don't fluctuate as dramatically and some analysts believe the indicator helps
better display trends in volatile markets.
WARNING:
- For purpose educate only
- This script to change bars colors.

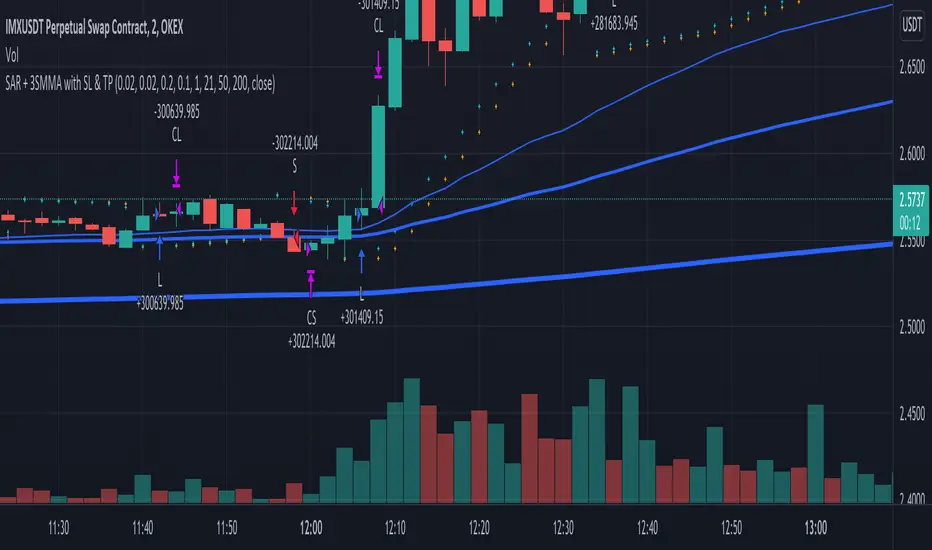
SAR + 3SMMA with SL & TPThis script is a combination of SAR strategy and 3 Smoothed Moving Averages.
Strategy:
Takes SAR longs when all 3 SMMAs are rising. Take SAR short when all 3 SMMAs are falling.
Supports StopLoss and TakeProfit.
If you have found a profitable setup for it, please share in the comments or private chat.
TICK strategy for SPY optionsImportant notes:
1. This strategy is designed for same day SPY option scalping. All profit shown in back testing report is based on Profit/Loss (P/L) estimates from trading options with approximately 6 months of data. By default, it is set to 10 option contracts. By default the initial capital is set to $5000. Pyramiding is set to 3.
2. This strategy works better with non-extended market data.
3. This strategy is mainly developed for SPY trading on 5 min chart, it probably will not be very profitable with other tickers or time frame without tweaking all the parameters first.
4. This strategy will work with QQQ as well, but please adjust the profit multiplier to match the P/L of QQQ options.
How it works:
When trading the indices, many rely on the TICK for market directions. This strategy is a trend following strategy that uses a combination of conditions using the following indicators:
- TICK
- RSI
- VIX volatility index
- EMA
For entries, the conditions are:
1. TICK moving average crossover with a delayed signal line
2. Bullish or bearish RSI signal, RSI > 50 for bullish, < 50 for bearish
3. VIX must be above a certain threshold to take advantage of high market volatility
4. Price must be on top of EMA line for long, and below for short
For exits, there are 3 scenarios:
1. Stop loss set by a percentage of the daily ATR value
2. Trend changes on the TICK and the RSI
3. Bearish or bullish divergence on price with TICK
This strategy automatically signal to close all trades at 3:50 pm EST at the end of the day.
Extras:
- There is an option to show P/L for reinvesting profits
Enjoy~!!! Let's all make $$$

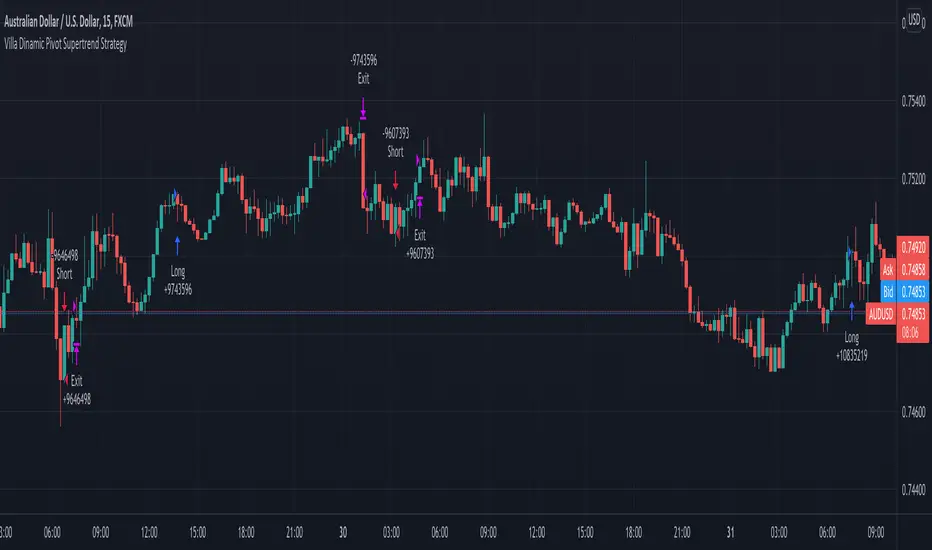
Villa Dinamic Pivot Supertrend StrategyThis strategy works better on AUD/USD in the 15 min timeframe. It uses the Pivot Supertrend to enter trades based on different filters such as:
- Simple EMA filter: that the 3 EMAs should be in order
- DEMA angle: you can choose the DEMA Angle threshold and the look back to check the angle to just trade trades with DEMA at a certain angle
- Simple DEMA filter: just check if close is above or below DEMA
- Take Every Supertrend Signal: this means to take every normal supertrend signal to not just wait for a pivot supertrend signal to enter a trade (specially on long pivot supertrend periods)
- Stop Loss at Supertrend: this means that the stop loss will be at the Normal Supertrend, if false the stop loss will be placed at the ATR level selected.
- 2 Steps Take Profit: this means if you want to close a percentage of position as soon as the normal supertrend crosses the entry price, you can select the % on the "2 Steps TP qty" input
- Stop Loss ATR Multiplier: if Stop Loss at Supertrend is off this will be the stoploss based on the atr
- Take Profit ATR Multiplier: if Stop Loss at Supertrend is off this will be the takeprofit based on the atr (you have to keep in mind that the ratio between this two will make the Risk to reward ratio of the take profit when the Stop Loss at Supertrend)
- Testing: to avoid overfitting, you can select date ranges for backtesting and forwardtesting and select which testing you wanna do
Uptrend and Oversold Index Swing Trading System 8H--- Foreword ---
The Overbought and Oversold Index Swing Trading System or short: I11L Hypertrend primarily uses money management Strategies, EMA and SMA and my momentum Ideas for trying to produce satisfactory Alpha over a timespan of multiple years.
--- How does it Work? ---
It uses 20 different EMA's and SMA's to produce a score for each Bar.
It will credit one Point If the EMA is above the SMA.
A high score means that there is a strong Uptrend.
Spotting the strong Uptrend early is important.
The I11L Hypertrend System trys to spot the "UPTREND" by checking for a crossover of the Score(EMA) / Score(SMA).
A low score means that there is a strong Downtrend.
Its quite common to see a reversal to the mean after a Downtrend and spotting the bottom is important.
The System trys to spot the reversal, or "OVERSOLD" state by a crossunder of the Score(EMA) / Score(SMA).
--- What can i customize? ---
-> Trading Mode: You can choose between two different trading modes, Oversold and Overbought(trend) and Random Buys to check if your systems Profitfactor is actually better then market.
-> Work with the total equity: The system uses the initial capital per default for Backtesting purposes but seeing the maximum drawdown in a compounding mode might help!
-> Use a trailing SL: A TSL trys to not lose too much if the trade goes against your TP
-> Lookbackdistance for the Score: A higher Lookbackdistance results in a more lagging indicator. You have to find the balance between the confirmation of the Signal and the frontrunning.
-> Leverage: To see how your strategie and your maximum Drawdown with the total equity mode enabled would have performed.
-> Risk Capital per Trade unleveraged: How much the underlying asset can go against your position before the TSL hits, or the SL if no TSL is set.
-> TPFactor: Your risk/reward Ratio. If you risk 3% and you set the ratio to 1.2, you will have a TP at 3 * 1.2 = 3.6%
-> Select Date: Works best in the 8H Timeframe for CFD's. Good for getting a sense of what overfitting actually means and how easy one can fool themself, find the highest Profitfactor setting in the first Sector (Start - 2012) and then see if the second Sector (2012 - Now) produces Alpha over the Random Buy mode.
--- I have some questions about the System ---
Dear reader, please ask the question in the comment Section and i will do my best to assist you.

Profit Harvester System
(1) Strategy Introduction
- This is a profit harvesting system, an optimized high frequency trading strategy, by invitation only
- It can achieve a stable average annual return and is suitable for most crypto-currency markets
- It is recommended that the initial capital of one crypto-currency pair is greater than 2000 USDT
- You need to bear some floating loss, but don't worry, the strategy will stop profit and reduce positions automatically
- Support leverage from 1 to 5 times, but note that there is a strong leveling risk when leverage is greater than 1 times
- Support strategy alerts. You can add alerts at the top of the trading panel
(2) Parameters
- Indicator Resolution
- Min Resolution (Minutes) : The resolution of the indicator, i.e. the interval for updating the indicator, default 240 minutes
- MA Trending Line
- Draw Trending Line? : Draw trend lines to determine the long/short direction
- Moving Average Type : Type of moving average, default is SMA
- Moving Average Period : The period of the moving average, SMA30 by default
- Normalized On Balance Volume
- Draw Normalized On Balance Volume? : Plot the normalized OBV to show the volume/price relationship
- Moving Average Type : Type of moving average, default is EMA
- Moving Average Period : The period of the moving average, EMA21 by default
- Sigma of Normalized On Balance Volume : Upper and lower range of normalized OBV for determining the energy of the volume/price relationship
- Trading settings
- What Trades Should Be Taken? : The trading direction, supports long only, short only or no trade
- Maximum Shares of Position : The maximum number of shares of the position, i.e. the initial capital (default is 2000) is divided into that number of shares equally
- First Shares on Entrying Position : The number of shares occupied when entrying position to avoid missing the trend market
- Profit Ratio for Average Entry Price : Close all positions and cancel all orders when the current price exceeds the average position price and the profit rate is reached
- Increase Ratio for Next Share : Equal proportion of the order price when adding position
- Trading Leverage (Risk Term) : Trading leverage supports from 1 to 5 times, 2 by default. However, there is a strong leveling risk when the leverage is greater than 1!
- Max Floating Loss of Equity (Risk Term) : How much do you wanna risk. When the max floating loss threshold is reached, the position will be closed and all orders will be canceled!
- Price Trail Stop : Whether enable price trail stop mode to obtain more profits
(3) About usage
- This strategy is by invitation only. If you are interested in this strategy or would like to use it, please leave a message
- The default parameters is suitable for VETUSDT, MATICUSDT, ATOMUSDT, XRPUSDT and so on
- It is highly recommended to use long-only direction rather than short-only direction because the market will not go down forever
(4) Exceptions
- When "Increase Ratio for Next Share" is too small and "Maximum Shares of Position" is too large, there may be an error that the number of orders exceeds 9000, which is caused by the limitation of tradingview itself
Happy trading and enjoy your life!
————————————————————————————————————————
(1) 策略简介
- 这是一个利润收割系统,一种优化的高频交易策略,仅限受邀请使用
- 可以达到稳定的平均年化收益率,且适用于大部分数字货币市场
- 建议单个数字货币交易对的基础资金大于2000USDT,避免单笔交易资金低于最低交易资金限制
- 需要您承受一定的浮亏,但是不用担心,本策略会自动执行止盈和解套
- 支持1至5倍的杠杆,但是需要注意,杠杆大于1倍时存在爆仓风险
- 支持策略提醒,在交易面板上方添加策略提醒即可
(2) 参数说明
- Indicator Resolution
- Min Resolution (Minutes) : 指标的分辨率,即更新指标的间隔,默认240分钟更新1次
- MA Trending Line
- Draw Trending Line? : 是否需要绘制趋势线,用于判断多空方向
- Moving Average Type : 移动平均线的类型,默认为SMA
- Moving Average Period : 移动平均线的周期,默认为240分钟下的30日均线
- Normalized On Balance Volume
- Draw Normalized On Balance Volume? : 是否需要绘制归一化OBV指标,该指标反应量价关系
- Moving Average Type : 移动平均线的类型,默认为EMA
- Moving Average Period : 移动平均线的周期,默认为240分钟下的21日均线
- Sigma of Normalized On Balance Volume : 归一化OBV的上下区间,用于判断量价关系的能量
- Trading settings
- What Trades Should Be Taken? : 代表可以交易的方向,支持仅多头、仅空头或不交易
- Maximum Shares of Position : 仓位的最大份数,即将初始资金(默认为2000)等分为该份数的资金
- First Shares on Entrying Position : 当开仓后,首仓占用的份数,以避免错过趋势行情
- Profit Ratio for Average Entry Price : 当前价格大于仓位均价,并达到该收益率时,关闭所有仓位并取消所有挂单
- Increase Ratio for Next Share : 等比加仓的价格比例
- Trading Leverage (Risk Term) : 交易杠杆,支持1-5倍杠杆,默认为2倍杠杆,但是杠杆大于1倍时存在爆仓风险!
- Max Floating Loss of Equity (Risk Term) : 自开仓开始,您愿意承受的最大浮亏,当达到该浮亏后,仓位全平并取消所有订单!
- Price Trail Stop : 是否启用尾单止盈模式,以收割更多的利润
(3) 使用说明
- 该策略仅限受邀请使用,如果您对该策略感兴趣或者想要使用我的脚本,请给我留言
- 默认参数适用于 VETUSDT MATICUSDT ATOMUSDT XRPUSDT 等交易对
- 强烈建议使用多头交易而不是空头交易,因为市场不会永远下跌
(4) 异常情况
- 当"Increase Ratio for Next Share"设置过小而"Maximum Shares of Position"设置过大时,可能会出现订单数量超过9000的错误,这是tradingview本身的限制导致的
祝大家交易愉快

MACD Strategy [Trading Nerd]This Strategy uses a EMA as a trend filter and MACD for entries. The stoploss can be calculated by the last highs/lows or by the ATR.
Entry Conditions
Long:
close price must be above the EMA
MACD-Line crossover MACD-Signal-Line
MACD-Signal- Line mus be below 0
Short:
close price must be below the EMA
MACD-Line crossunder MACD-Signal-Line
MACD-Signal- Line mus be above 0
Exit Conditions
The Stoploss can be set in two different ways:
1. By the calculated ATR value of the entry Candle. This Value can be multiplied with the ATR multiplier for SL .
For Longs: SL = entry Price - ATR * ATR-multiplier
For Shorts: SL = entry Price + ATR * ATR-multiplier
2. By the previous highest high or lowest low (also called Donchain Channels). The lookback length can be changed in the at Lookback length for HH/LL SL .
For Longs: SL = LL of the last X candles
For Shorts: SL = HH of the last X candles
Take Profit
The TP is calculated by the Risk * Risk Reward Ratio . The Risk Reward Ratio can be changed in the Settings. The Risk is the difference of entry price and stoploss price: Risk = absolute(entry price - stoploss price)
For Longs: TP = entry Price + Risk * Risk Reward Ratio.
For Shorts: TP = entry Price - Risk * Risk Reward Ratio.
Risk Management
You can set the Risk % per Trade in the settings. A Value of 2 means that the position size is calculated in a way that at a loosing trade the strategy will only loose 2% of the current capital (initial capital + net profit).
E.g.: The current capital is $1000 and a trade hits the SL. The strategy will only loose $20.
Info for Alerts: Alert message conversion of JSON Strings. You don't need to add any or \" to the alert String.
When you create the Alert the Message must be: {{strategy.order.alert_message}}

EMA Cloud Intraday Strategy********NOT TRADING ADVICE - USE AT YOUR OWN RISK - TRADING IS RISKY - DO NOT BLINDLY FOLLOW THE SIGNALS FROM THIS STRATEGY********
This strategy utilizes the 9 and 20 period exponential moving averages to create a colored cloud between similar to what is seen on the Ichimoku Cloud. The strategy closes all trades by the end of the trading day. Entry is when the price closes above a Green (9 EMA above 20 EMA) cloud or below a Red (9 EMA below 20 EMA) cloud. Exit is when price closes against the 9 EMA or at the end of the trading day. Running the strategy tester on different intraday time frames will show the best time frame for a given Symbol. For example, I have found that the best results are returned by this strategy for SPY on the 30 minute time frame.
********NOT TRADING ADVICE - USE AT YOUR OWN RISK - TRADING IS RISKY - DO NOT BLINDLY FOLLOW THE SIGNALS FROM THIS STRATEGY********

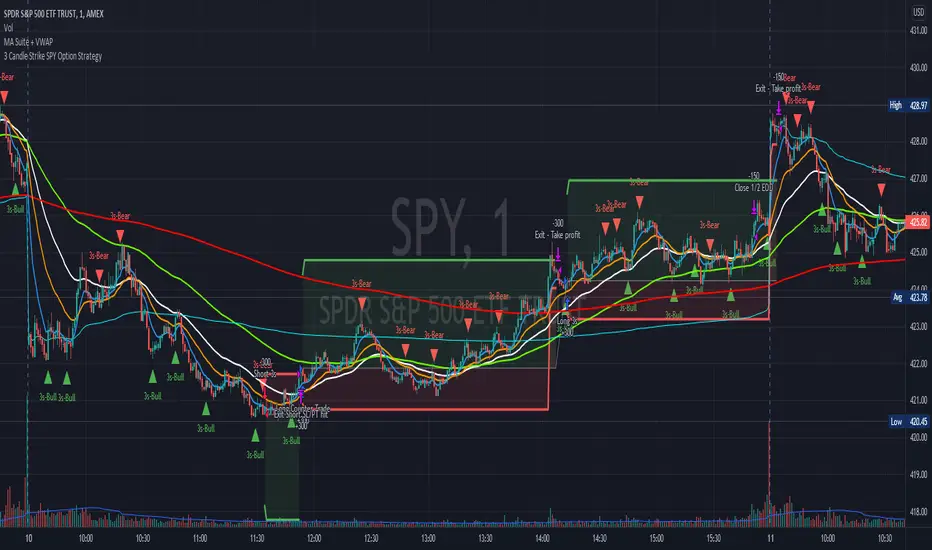
3 Candle Strike SPY Option StrategyImportant notes:
1. This strategy is designed for same day SPY option scalping. All profit shown in back testing report is based on Profit/Loss (P/L) estimates from trading options with approximately 7.5 weeks of data. By default, it is set to 10 option contracts. By default the initial capital is set to $5000.
2. This strategy also takes into account of extended market data, so turn it on for it to work as intended.
3. This strategy is mainly developed for SPY trading on 1 min chart, it probably will not work with other tickers without tweaking all the parameters first.
4. At the time of publish, the market is experiencing high volatility. Keep that in mind as market conditions changes constantly.
How it works:
Basic idea of this strategy is to look for 3 candle reversal pattern within trending market structure. The 3 candle reversal pattern consist of 3 consecutive bullish or bearish candles, followed by an engulfing candle in the opposite direction. This pattern usually signals a reversal of short term trend (a.k.a pullbacks). This strategy uses multiple moving averages to filter long or short entries. For example, if the 21 smoothed moving average is above the 50, only look for long (bullish) entries, and vise versa. There are settings to change these moving average periods to suit your needs. Linear Regression to determine whether the market is trending. The 3 candle pattern is more successful under trending market.
This strategy aims for approximately 1:3 risk to reward ratio. Stop losses are calculated using the closest low or high values for long or short entries, respectively, with an offset using a percentage of the daily ATR value. This allows some price fluctuation without being stopped out prematurely. Price target is calculated by multiplying the difference between the entry price and the stop loss by a factor of 3. When price target is reach, this strategy will set stop loss at the price target and wait for exit conditions to maximize potential profit.
By default, the strategy signals a trade in the opposite direction if the previous one had resulted in a loss. Often times, this opposite trade results in profit.
This strategy automatically signal to close all trades at 3:50 pm EST at the end of the day.
Enjoy~!!! Let's all make $$$
Perfect OrderEntry Point
How to Entry
Perfect Order Entry
SMA5,13,21 & EMA75,90,200
Please enjoy your entry

Kahlman HullMA / WT Cross StrategyA strategy created using Hull Moving Average and WT Cross .
Hull Moving Average turns green and WT Cross crossover this is a long. Otherwise short.
Stop Loss and Take Profit settings are available. You can set it to the level you want or turn it off.
According to my measurements, it shows the best performance in the 4-hour period. But you can find the best settings that are correct from the Strategy settings.

SSL + Wavetrend (7 indicators) by TradeSmartHello everyone! This script is implementing a strategy that uses 7 indicators: SSL, Wavetrend, SSL Hybrid, Keltner Channel, EMA, Candle Height and ATR. This is the 2nd best strategy that we have tested so far (based on the 100 backtests).
STRATEGY ENTRY RULES
Long entry: go long if SSL Hybrid is blue (between last candle and entry candle) and SSL Channel crosses up (green SSL line is on the top) and Wave Trend prints green dot (candle color turns yellow) and entry Candle Height is not higher than 0.6 and entry candle is inside the Keltner Channel and price target does not hit the 200 EMA.
Short entry: go short if SSL Hybrid is pink (between last candle and entry candle) and SSL Channel crosses down (red SSL line is on the top) and Wave Trend prints red dot (candle color turns blue) and entry Candle Height is not higher than 0.6 and entry candle is inside the Keltner Channel and price target does not hit the 200 EMA.
EXIT STRATEGY
The strategy will exit based on a set ATR value. Take profit and stop loss levels can be changed with risk/reward settings.
CHANGEABLE SETTINGS
Wave Trend: Channel Length, Average Length, Wave Trend Limit High, Wave Trend Limit Low
SSL: Period
SSL Hybrid: SSL1 / Baseline Type, SSL1 / Baseline Length, Base Channel Multiplier
Target Price Limit: can set 6 different limiters for long and short entries
Candle Height Limit: Limit based on, Candle Limit High, Candle Limit Low
Keltner Channel: Limit range long, Limit range short, Length, Multiplier, Source, Use Exponential MA, Bands Style, ATR Length
Exit strategy: ATR Length, ATR Smoothing, Stop Loss Multiplier (risk), Exit Price Multiplier (reward)
Setups: Capital Percentage, Risk Percentage, Allow Long Entries, Allow Short Entries
Date Range: Limit Between Dates, Start Date, End Date
Trading Time: Valid Trading Days
FIRST RELEASE SETTINGS FOR ALGOUSDT 30 M (3/19/2022)
Wave Trend: Channel Length = 11, Average Length = 19, Wave Trend Limit High = 27, Wave Trend Limit Low = -48
SSL: Period = 10
SSL Hybrid: SSL1 / Baseline Type = EMA, SSL1 / Baseline Length = 36, Base Channel Multiplier = 0.21
Target Price Limit: can set 6 different limiters for long and short entries: all false
Candle Height Limit: Limit based on: Candle Body (open/close), Candle Limit High = disabled, Candle Limit Low = enabled, 0.32
Keltner Channel: Limit range long = enabled, Full range, Limit range short = enabled, Full range, Length = 3, Multiplier = 1, Source = close, Use Exponential MA = enabled, Bands Style = Average True Range, ATR Length = 11
Exit strategy: ATR Length = 14, ATR Smoothing = EMA, Stop Loss Multiplier (risk) = 1.9, Exit Price Multiplier (reward) = 2
Setups: Capital Percentage = disabled, Risk Percentage = enabled, 1, Allow Long Entries = enabled, Allow Short Entries = enabled
Date Range: Limit Between Dates = disabled, Start Date, End Date
Trading Time: Valid Trading Days = 1234567
Hope you like this strategy, feel free to check all of our scripts. Thank you for your support!


TTC2022SPY4hrThis is version 1.0 "TTC2022SPY4hr" Strategy. This has only been back tested for the ticker "SPY" on the 4hr ext chart for the year 2022. The reason I isolated this strategy to 2022 is because SPY's chart patterns have changed from the previous 2 years. So, I wanted to develop an indicator-based strategy that was consistent with current market conditions. The default setting for percent of equity is set to 5% risk. I will adjust any variables that make this TTC2022SPY4hr Strategy more accurate in the future as more 2022 data comes out.
It's based on my TTC: Triangular Trend Channel script that dynamically creates a trend channel on the move. It uses open, high, low, close, simple moving average inputs for its plot lines and ema1 & a hard coded ema5 for calculation purposes. The default trend channel line settings are based off sma7.
Default color coded in top to bottom price order:
green = top
orange
blue
white = center (7sma)
purple
yellow
red = bottom
• Remember * This has only been back tested for the ticker "SPY" on the 4hr ext chart for the year 2022 to date. *

Top 40 High Low Strategy for SPY, 5minThis strategy is developed based on my High Low Index SPY Top 40 indicator
Notes:
- this strategy is only developed for SPY on the 5 min chart . It seems to work with QQQ as well, but it isn't optimized for it
- P/L shown is based on 10 SPY option contracts, call or put, with strike price closest to the entry SPY price and expiry of 0 to 1 day. This includes commissions (can be changed). This is only an estimate calculated using an arbitrary multiplier factor, this can be changed in the setting
- P/L is based on $5000 initial capital
- Works with both regular / extended trading session turned on/off. However, max drawdown is 1/2 with extended trading session ON
- there is still a bug that doesn't allow alert to be created due to calculation error, will update once fixed
This strategy combines signals from the following indicators to determine entry signals:
- High Low Index SPY Top 40
- MACD
- Linear Regression Slope
Entry signal is triggered when:
- High Low Index line crosses the EMA line
- MACD trending in the same direction
- Linear Regression slope is accelerating above a threshold in the same direction, indicating a strong trend
Profit target(PT) and stop loss(SL) are determined using ATR value, with 2:1 Reward to Risk ratio as default.
Exit signal may be triggered prior to PT or SL trigger when:
- High Low Index SPY Top 40 shows a reversal after overbought or oversold conditions (optional)
- Opposite entry signal is triggered
There are a number of optional settings:
- Turn on/off "option trading", P/L will be calculated using share price only without multiplication factor for trading option contracts
- # of options per trade, default to 10
- Reinvest with profit made
- Trade with trailing SL after PT hit
- Take profit early based on Top 40 overbought/oversold
- Trade 0/1 day expiry. This will signal exit by the end of the day on Mon/Wed/Fri, and only exits 1/2 of positions (if in profit) on Tues/Thurs
- Can reduce the SL level without impacting PT
- No entry between 10:05 - 10:20 (don't ask me why, but statistically it performs better)
Consider donating me some of your profit if you make $$$ hahaha~ ;)
Enjoy~~
