VOLATILITY BANDS BY ISHUThis is the simple trading system based on volatility where these bands are used as entry points and trailing stops . A brief explanation of the system is as below.
Because the volatility of a stock is its standard deviation, we can statistically establish “confidence Intervals” of the price moves. In statistics, a one standard deviation range means that there is a 68-
percent likelihood the stock price will stay within the range (a 67-percent confidence interval). The confidence value for different standard deviations are
1.00 - 68%
1.28 - 80%
1.50 - 88%
2.00 - 95%
So, we draw bands at various standard deviation levels like 0.25, 0.5, 1, 1.28, 1.65 and 2 from the previous day’s close. Entry is made once the price cross above a Band and the same band because the stop loss. When the price crosses above the next band the stop loss is shifted to this band value. This point can be also a “ADD ON” point. In the same way trading can be done on the down side as well.
The current formula uses the VIX values of the previous day which is available from NSE web site. The High Value of the VIX is used for the higher Bands and the Low value of the VIX is use for the lower Bands. This is Intraday Trading system only. The system is ideally suited for the Index as it is based on the VIX.
This system belongs solely to @karthikmarar , all credits goes to Mr.karthik , i am feeling very grateful blessed and privileged at same time as i came across his huge sea of knowledge. Please give a visit on his page, follow him and show your support !🙏🏻
Niftybank

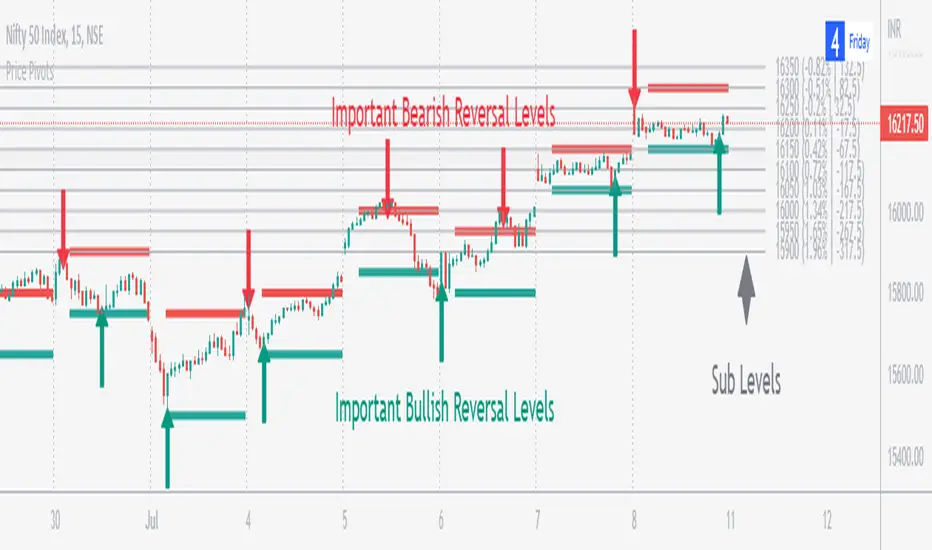
Price Pivots for NSE Index & F&O StocksPrice Pivots for NSE Index & F&O Stocks
What is this Indicator?
• This indicator calculates the price range a Stock or Index can move in a Day, Week or Month.
Advantages of this Indicator
• This is a Leading indicator, not Dynamic or Repaint.
• Helps to identify the tight range of price movement.
• Can easily identify the Options strike price.
• The levels are more reliable and authentic than Gann Square of 9 Levels.
• Develops a discipline in placing Targets.
Disadvantages of this Indicator
• The indicator is specifically made for National Stock Exchange of India (NSE) listed index and stocks.
• The indicator is calculated only for index NIFTY, BANKNIFTY, FINNIFTY, MIDCPNIFTY and Stocks listed in Futures and Options.
• The indicator shows nothing for other indexes and stocks other than above mentioned.
• The data need to be entered manually.
• The data need to be updated manually when the F&O listed stocks are updated.
Who to use?
Highly beneficial for Day Traders, it can be used for Swing and Positions as well.
What timeframe to use?
• Any timeframe.
• The highlighted levels in Red and Green will not show correct levels in 1 minute timeframe.
• 5min is recommended for Day Traders.
When to use?
• Wait for proper swing to form.
• Recommended to avoid 1st 1 hour or market open, that is 9.15am to 10.15 or 10.30am.
• Within this time a proper swing will be formed.
How to use?
Entry
• Enter when the Price reach closer to the Blue line.
• Enter Long when the Price takes a pullback or breakout at the Red lines.
Exit
• Exit position when the Price reach closer to the Red lines in Long positions.
What are the Lines?
Gray Lines:
• Every lines with price labels are the Strike Prices in the Option Chain from NSE website.
• Price moves from 1 Strike Price level to another.
• The dashed lines are average levels of 2 Strike Prices.
Red & Green Lines:
• The Red and Green Lines will appear only after the first 1 hour.
• The levels are calculated based on the 1st 1 hour.
• Red Lines are important Resistance levels, these are strong Bearish reversal points. It is also a breakout level, this need to be figured out from the past levels, trend, percentage change and consolidation.
• Green Lines are important Support levels, these are strong Bullish reversal points. It is also a breakdown level, this need to be figured out from the past levels, trend, percentage change and consolidation.
What are the Labels?
• First Number: Price of that level.
• Numbers in (): Percentage change and Change of price from LTP(Last Traded Price) to that Level.
How to use?
Entry:
• Enter when price is closer to the Red or Green lines.
• Enter after considering previous Swing and Trend.
• Note the 50% of previous Swing.
• Enter Short when price reverse from each level.
• If 50% of swing and the pivot level is closer it can be a good entry.
Exit:
• Use the logic of Entry, each level can be a target.
• Exit when price is closer to the Red or Green lines.
Indicator Menu
Source
• Custom: Enter the price manually after choosing the Source as Custom to show the Pivots at that price.
• LTP: Pivot is calculated based on Last Traded Price.
• Day Open: Pivot is calculated based on current day opening price.
• PD Close: Pivot is calculated based on previous day closing price.
• PD HL2: Pivot is calculated based on previous day average of High and Low.
• PD HLC3: Pivot is calculated based on previous day average of High, Low and Close.
"Time (IST) (Vertical)"
• This is a marker of every 1 hour.
• Usually major price movement happen between previous day last 1 hour (2:15 pm) to today first 1 hour (10:15 pm).
• Two swings can happen between first 2 hour of current day.
• At the end of the day last 1 hour from 2.15 pm another important movement will happen.
• Usually rest of the time won't show any interesting movement.
To the Users
• Certain symbols may show the levels as a single line. For such symbols choose a different Source or Timeframe from the indicator menu.
• Please inform if any of the Symbol's price levels don't react to the pivots, include the Symbol a well.
• Also inform if you notice any wrong values, errors or abnormal behavior in the indicator.
• Feel free to suggest or adding new features and options.
General Tips
• It is good if Stock trend is same as that of NIFTY trend.
• Lots of indicators creates lots of confusion.
• Keep the chart simple and clean.
• Buy Low and Sell High.
• Master averages or 50%.
• Previous Swing High and Swing Low are crucial.
Chirag Strategy SMA with StopLossThe Moving Average Crossover trading strategy is possibly the most popular trading strategy in the world of trading. This strategy is a good example of so-called traditional strategies. Traditional strategies are always long or short. That means they are never out of the market. The concept of having a strategy that is always long or short may be scary, particularly in today’s market where you don’t know what is going to happen as far as risk on any one market. But a lot of traders believe that the concept is still valid, especially for those of traders who do their own research or their own discretionary trading.
This version uses crossover of simple moving averages of length 10 and 13. This strategy is best suitable for NIFTY and BANKNIFTY under 15min candlestick for intraday and 1hour candlestick for long-term.

[VDB]Advanced BankNifty VolumeNSE:BANKNIFTY Index is traded significantly along with NIFTY and having a VOLUME indicator is very helpful for those who follow it extensively as it is used to measure the relative significance of a price move. Given TradingView doesn’t provide the VOLUME on Index chart, many end up using BANKNIFTY FUTURE chart for volume information. This indicator helps providing that VOLUME information.
Get VOLUME You Prefer –
FUTURE : This extracts VOLUME data from BANKNIFTY FUTURE chart.
INDEX : VOLUME is calculated by the weighted sum (Composite method) of underlying stock’s spot volume for all the 12 stocks of the Bank Nifty Index.
INPUTS :
Volume Moving Average in added to show the LINE and also used in calculation to change volume bars color if that input is selected.
Color Bars Based on Average VOLUME : Selecting this helps changing the Color of VOLUME bars to lighter color if volume < average volume.
Color Bars Based on Previous Close : Selecting this input changes the Color of VOLUME bars based on “Previous Close” than “Current Open”.
BANKS & WEIGHTAGE : Here all 12 underlying banking stocks of Bank Nifty Index are listed along with their weightage in the index.
IMPORTANT NOTE : Changing any settings of the indicator leads to its complete recalculation. The result may differ from the expected one. Weightage of each stock changes by end of every month. Always to refer NSE NIFTY BANK composition and weightage from NSE website.
DISCLAIMER : This indicator has been created for educational reference only and do not constitute investment advice. This indicator should not be relied upon as a substitute for extensive independent market research before making your actual trading decisions. Market data or any other content is subject to change at any time without notice. Liability for any loss or damage, including without limitation any loss of profit, which may arise directly or indirectly from use of this indicator is accountability of user.

TEWY - Breadth Based Bar ColorNSE:BANKNIFTY1!
⚠ Important: Before going into details of this script, in order to best use this indicator it is VERY VERY important to make some changes to the chart settings as mentioned below.
• REMOVE CANDLE BORDERS from Symbol settings
• CHANGE WICK COLOR to white/black/gray based on the chart theme you use, from Symbol settings
Make sure you have these settings done.
Detail about this indicator
1. This indicator is used to identify the trend based on the momentum of the counter selected.
2. This indicator is calculated differently for indices NSE:NIFTY and NSE:BANKNIFTY. As I take high weightage stock under these indices to get overall indices momentum.
3. I have used the rate of change and RSI of it to calculate momentum.
4. I would typically use this indicator to see momentum on the Monthly and Weekly first and daily timeframe to get proper entry.
5. Also please try to stay in the long position more than the short position as we all know that, the imminent nature of the market is to go upward only.
6. Please try to keep base inputs as defaults, though it allows you to change input parameters like changing the length of momentum indicator or bar color options. Below is the description of each input
• Smoothen: It changes source from CLOSE to OHLC4.
• Signal Length: It's the length(no of candles) for which the momentum is calculated. Like for RSI the default period/length is 14 or for Moving Average indicator default period/length is 9, I simply use 20 as the default length
• Timeframe: If you want to calculate momentum based on the momentum of different time frames.
• Change bar Color: Use the toggle to change the color of the bar. You can uncheck it so that no bar color is changed if you need so
• Set Bar Color Dynamically: With this even though the oscillator is in opposite direction to the trend it takes the candle close into consideration and sets bar color accordingly.
Always respect RISKS and follow stop loss.
Let's understand how to take a position using this indicator
• Long position:-
• If the latest candle color is GREEN and its preceding candle color is RED, then go long in the counter with the strict stop loss(SL) 1% below the preceding RED colored candle.
• Once you are in a long position, trail stop loss(SL) below each red candle you see on the chart.
• Exit strictly if initial SL or trailing SL is hit. And re-create long positions once you see the next green candle.
• Short Position:-
• If the latest candle color is RED and its preceding candle color is GREEN, then go short IF RED COLORED CANDLE LOW IS TAKEN OUT. Exit short once you see a green colored candle.
• Exit strictly if you see a GREEN-colored candle and create a long position.
If you are really interested and need access to this indicator please DM me.
I have given a sample illustrational image below, which should help you understand this indicator.
Best of luck

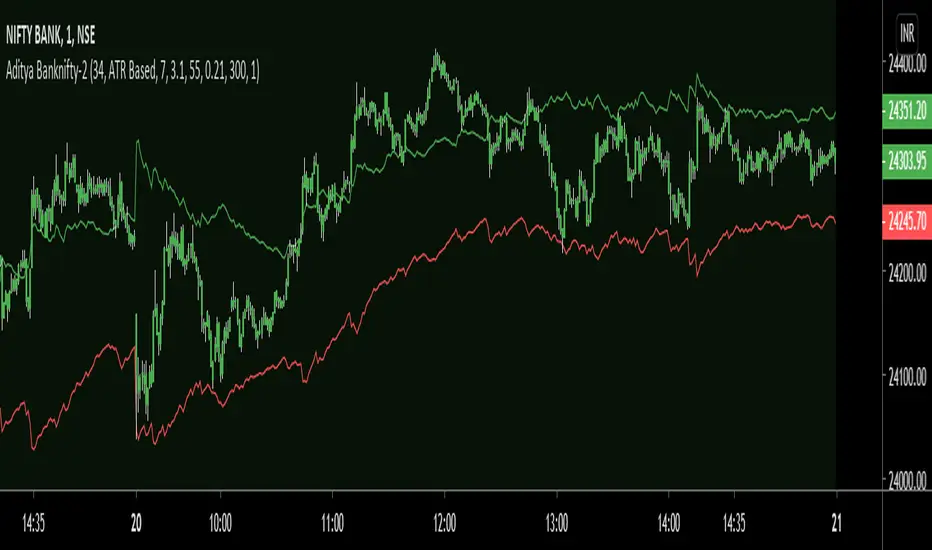
Aditya Banknifty-2 IndicatorThis indicator is designed for Banknifty which is traded on NSE(India). It works best in 1-M and 5-M time-frame. You can always experiment with any other time-frame with various combinations of settings.
Green Line- Buy Trigger Line
Red Line- Sell Trigger Line
Period: No. bars for look-back period.
Trade Trigger Type:
1. ATR Based – Trade will be initiated based on ATR values.
For 1M time-frame: Trigger ATR Bars=7
ATR Multiplier = 3.1
For 5M time-frame: Trigger ATR Bars=7
ATR Multiplier = 0.5
2. Fixed - – Trade will be initiated based on particular fixed value.
3. % of Close - Trade will be initiated based on % of Close of script.
Take Partial Profit: Whether to book partial or not.
Partial Profit Points: It always better to book partial profit after getting into the trade. We can book 1 quantity after our partial profit target is hit by making Order Size=2 and let the remaining quantity in the trade until the reversal of trend.
Disclaimer: This script/strategy is for educational purpose and individual use only. The author of this script/strategy will not accept any liability for loss or damage as a result of reliance on the information contained in the charts. Please be fully informed regarding the risks and costs associated with trading the financial markets.
This is a premium indicator so send me a private message for access.
Use the link below to obtain access to this indicator.
NKP BNF Scalper V1NKP BNF Scalper V1 is an indicator. It will work only on NSE - BANK NIFTY Futures it was designed based on proven intraday strategy. It will plot buy / sell signal and SL line in live market based on custom calculated information about entry points at close of the candle. Buy/ Sell signal is the best entry point but you can enter at the next candle.
we can see signals like buy/sell/ - 3 min candle (Intraday trading)
if the buy signal came then go for long if sell signal came then go for short.
How does it work?
buy - take the buy order in next candle open's stop loss will be at SL line
sell - take the sell order in next candle open's stop loss will be sat SL line
What are the signals?
Yes it will generate the buy/sell signals in the live market
these signal will plot buy/sell labels based on signal.
Can we set the Alert on this?
Yes, we can set the alert based on the signals
Four custom alerts - NKP Buy , NKP Sell
How does it work?
buy - Take the buy order when BUY signal came on the 3min candle
sell - Take the sell order when SELL signal came on the 3min candle
IMPORTANT: this script does not generate exit signals and those should be find using money management rules or else. Perfectly catches long runs in trends at all underlings (stocks, indexes ) at 5 min time frame. Lower/High period gives more incorrect signals and shorter runs on below 5 min period , higher period gives you late entry and less. Of course it gives false signals from time to time but fortunately it makes a correction very fast.
Try it! Good luck and good trading!
"Use the link below to obtain access to this indicator" or "PM us to obtain access."

Weighted Bank MovementThe indicator comprises of a solid line that moves from -100 to +100 signifying the % of weighted movement among 12 banking stock constituting to the BANK NIFTY movement.
A positive value denotes the percentage of banks among the 12 banks that are trading above the previous HLC average ( High , Low , Close ) and vice versa a negative value denotes the percentage of banks trading below the previous HLC ( High , Low , Close ) average.
Comments and feedback are welcome.
Should you have any doubts or wish to access the script then please feel free to DM me.


