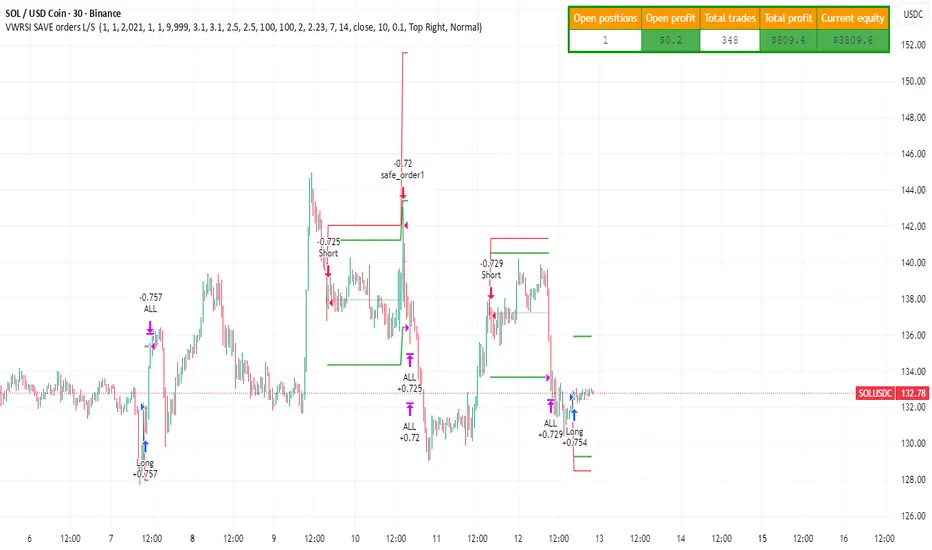
Strategy with VWRSI and SAVE orders Long or Short or BothVWRSI is very powerful indicator coded by Algo Alpha and I Make Strategy of it
But there is no stop loss instate the Strategy is using Save orders to minimize the market manipulation
The best to used is side way market with long and short enable
The Strategy trigger long or short market order -
long - ta.crossover(rsi, 20)
short - ta.crossunder(rsi, 80)
And if is not take profit from the first trade start with the save trades until will do
the sum of the first order - base order and the save order can be adjust from the user
as well the deviation from the first order
IF some user have questions let me know
מתנדים
[SM-021] Gaussian Trend System [Optimized]This script is a comprehensive trend-following strategy centered around a Gaussian Channel. It is designed to capture significant market movements while filtering out noise during consolidation phases. This version (v2) introduces code optimizations using Pine Script v6 Arrays and a new Intraday Time Control feature.
1. Core Methodology & Math
The foundation of this strategy is the Gaussian Filter, originally conceptualized by @DonovanWall.
Gaussian Poles: Unlike standard moving averages (SMA/EMA), this filter uses "poles" (referencing signal processing logic) to reduce lag while maintaining smoothness.
Array Optimization: In this specific iteration, the f_pole function has been refactored to utilize Pine Script Arrays. This improves calculation efficiency and rendering speed compared to recursive variable calls, especially when calculating deep historical data.
Channel Logic: The strategy calculates a "Filtered True Range" to create High and Low bands around the main Gaussian line.
Long Entry: Price closes above the High Band.
Short Entry: Price closes below the Low Band.
2. Signal Filtering (Confluence)
To reduce false signals common in trend-following systems, the strategy employs a "confluence" approach using three additional layers:
Baseline Filter: A 200-period (customizable) EMA or SMA acts as a regime filter. Longs are only taken above the baseline; Shorts only below.
ADX Filter (Volatility): The Average Directional Index (ADX) is used to measure trend strength. If the ADX is below a user-defined threshold (default: 20), the market is considered "choppy," and new entries are blocked.
Momentum Check: A Stochastic RSI check ensures that momentum aligns with the breakout direction.
3. NEW: Intraday Session Filter
Per user requests, a time-based filter has been added to restrict trading activity to specific market sessions (e.g., the New York Open).
How it works: Users can toggle a checkbox to enable/disable the filter.
Configuration: You can define a specific time range (Default: 09:30 - 16:00) and a specific Timezone (Default: New York).
Logic: The strategy longCondition and shortCondition now check if the current bar's timestamp falls within this window. If outside the window, no new entries are generated, though existing trades are managed normally.
4. Risk Management
The strategy relies on volatility-based exits rather than fixed percentage stops:
ATR Stop Loss: A multiple of the Average True Range (ATR) is calculated at the moment of entry to set a dynamic Stop Loss.
ATR Take Profit: An optional Reward-to-Risk (RR) ratio can be set to place a Take Profit target relative to the Stop Loss distance.
Band Exit: If the trend reverses and price crosses the opposite band, the trade is closed immediately to prevent large drawdowns.
Credits & Attribution
Original Gaussian Logic: Developed by @DonovanWalll. This script utilizes his mathematical formula for the pole filters.
Strategy Wrapper & Array Refactor: Developed by @sebamarghella.
Community Request: The Intraday Session Filter was added to assist traders focusing on specific liquidity windows.
Disclaimer: This strategy is for educational purposes. Past performance is not indicative of future results. Please use the settings menu to adjust the Session Time and Risk parameters to fit your specific asset class.

Ichimoku Kijun OPTIMISED FOR 15MIN EURUSDWhen to Enter a Trade (The Kijun Bounce)
We only enter when the market is clearly trending and we get a good pullback to the Kijun-sen (the red line).
Market Quality Check (Anti-Chop):
The price must be completely outside the Ichimoku Cloud (Kumo). This ensures we are not trading in a choppy, sideways market.
Buy (Long) Entry:
The price (low of the candle) drops down and touches the Kijun-sen (red line).
The candle then closes above the Kijun-sen, confirming the trend is holding and the bounce is real.
Sell (Short) Entry:
The price (high of the candle) rises up and touches the Kijun-sen (red line).
The candle then closes below the Kijun-sen, confirming the downtrend is holding and the rejection is real.
How to Manage Risk and Exit
We use a fixed profit target (Take Profit) and a dynamic Stop Loss (Trailing Stop) that follows the Kijun-sen.
Risk per Trade:
We risk 1.0 percent of the total account equity per trade.
The initial Stop Loss distance is limited to 1.0 times the ATR, and is strictly capped at 1.0 percent of the price to prevent any single catastrophic loss.
Take Profit (TP):
The fixed profit target is set to a 1.5 Risk to Reward ratio (1.5 R:R) . This means the profit target is 1.5 times the size of the initial stop loss.
Stop Loss (SL):
The Stop Loss is a Trailing Stop that automatically moves with the Kijun-sen (red line).
The Stop Loss will trail slightly below the Kijun-sen for a Buy trade, and slightly above the Kijun-sen for a Sell trade, protecting profits dynamically as the trend continues.
Understanding the Trade Signals
🟢🟡 The Round Dots (Entry Signals)
The small, round dots are placed directly on the candle where the strategy decided to enter a trade. The color tells you the direction:
Lime Green Dot: Signals a confirmed Long (Buy) Entry. This happens on the candle where the price successfully bounced off the Kijun-sen (red line) and closed higher, and the market was outside the Kumo (the cloud).
Red Dot: Signals a confirmed Short (Sell) Entry. This happens on the candle where the price was successfully rejected by the Kijun-sen (red line) and closed lower, and the market was outside the Kumo.
⬆️⬇️ The Arrows (Exit Signals)
The arrows appear at the exact price level where the trade was closed (exited). The direction of the arrow indicates where the exit occurred relative to the market action, but the color is more important for determining the result:
Exit Arrow (Often Green/Red): This signals a trade was closed for one of two reasons:
Take Profit (Limit Hit): The trade moved in your favor and hit the fixed 1.5 R:R profit target. This is a successful, profitable exit.
Stop Loss (Trailing Stop Hit): The market reversed against the position, and the trade was closed by the dynamic Kijun-sen Trailing Stop. This is a risk-controlled loss or a break-even exit.
The size of these arrows is the default setting used by the strategy.exit() function in Pine Script to clearly mark the exit price on the chart.
In Summary
The dots tell you when to get in (Entry) based on the Kijun Reversion rule, and the arrows tell you when you got out (Exit) due to hitting either the target profit or the trailing stop loss.

Velocity SwingtraderThe intended objective of this indicator to gauge trend and momentum and find trades that are at the beginning of a trend change for longer periods of time (days, weeks, months).

Range Strategy (kasatura84)Winning Range Strategy (Set Heikin Ashi Candles)
Incredible winning strategy. You have to set Heikin Ashi Candles to activate strategy! It works both long and short trades.

SVTR [Ultimate]SVTR v1.0 is a fully automated trading strategy designed to identify high-probability market opportunities using structured momentum, trend validation, and risk-controlled execution logic.
This strategy is not a simple signal generator.
It is a complete decision engine that evaluates market conditions, confirms entries with multiple filters, and manages trades automatically according to predefined logic.
Built for traders who want consistency, discipline, and objective execution, SVTR removes emotional bias and delivers rule-based trading across different market environments.
KEY FEATURES
• Fully automated entry and exit logic
• Multi-layer confirmation system
• Momentum and trend validation
• Smart trade filtering to reduce noise
• Works on multiple markets and timeframes
• Non-repainting logic
• Alert-ready for automation and integrations
AUTOMATED STRATEGY LOGIC
SVTR continuously analyzes the market and only executes trades when all required conditions align.
This prevents overtrading and avoids weak or low-quality setups.
The strategy is designed to:
Enter when momentum and direction are confirmed
Avoid choppy and uncertain market phases
Exit trades based on objective, rule-driven logic
Maintain consistency regardless of emotions or bias
WHY THIS STRATEGY?
Most traders fail not because of bad ideas, but because of:
Late entries
Emotional decisions
Overtrading
Lack of discipline
SVTR v1.0 solves these problems by automating the decision process and executing trades exactly as designed, every time.
You trade the system.
Not your emotions.
WHO IS IT FOR?
• Traders looking for automated execution
• System-based and rule-driven traders
• Swing traders and intraday traders
• Traders who want consistency over discretion
• Users who want a ready-to-use strategy framework
IMPORTANT NOTES
• Invite-Only / Private access
• Source code is protected
• Designed for backtesting, automation, and live monitoring
• Strategy behavior may vary depending on market conditions and settings
VERSION
v1.0 – Initial Private Release
Future updates may include optimizations, additional filters, and performance improvements.
FINAL STATEMENT
SVTR v1.0 is built for traders who value structure, confirmation, and automation over guesswork.
If you are looking for a strategy that executes with discipline, filters weak setups, and operates as a complete automated system, this strategy is designed for you.

King StrategyKing Strategy is an all-in-one TradingView edge for scalpers, swing traders and prop- or hedge-fund pros alike. It blends classic pattern flags with institutional-grade filters to pinpoint high-probability long entries and exits—and displays them with instant visual cues (buy/sell flags, dynamic backgrounds, trend-lines, support/resistance and volume-zones).
Built-in time-of-day and cycle locks help tame overtrading, and every signal lives in a single Inputs panel so you can toggle filters, tweak risk parameters and dial in exits in seconds. Whether you’re chasing 1-minute scalps or planning multi-day swings, S85 keeps you in sync with the market—just fine-tune its tools to match your timeframe, liquidity and comfort with risk.

StrategyScript77 Is a rule-based strategy built on top of an Ichimoku based engine.
Ichimoku concepts are used as the backbone for trend and momentum filtering, so the strategy tends to stay on the side of the dominant move instead of fighting it.
The name “Super77” comes from the behavior I consistently observed in testing because the win rate tends to hover around the 70–80% range, often clustering around ~77% when used as intended.
It’s not a promise or guarantee, but it reflects the core design philosophy: frequent, relatively small but steady wins, with controlled and manageable losses.
Trading Style – Built for Conservative Traders
Super77 is intentionally designed for traders who prefer a conservative and calm approach:
Entries only at bar close
The strategy waits for bar close confirmation before entering a position. No intrabar guessing, no chasing half-formed signals. If the signal is still valid at close, only then will it enter.
Exits automated on bar close
Exits are also managed on bar close, which makes the logic transparent, easy to review on the chart, and more robust in backtesting compared to tick-based or intrabar hacks.
Semi-auto friendly
If you like to keep some discretion, you can treat it as semi-automatic:
Let the strategy generate entry signals
Manually cancel or skip certain trades if market context changes (news, extreme volatility, etc.)
This combination makes Super77 suitable for traders who don’t want to stare at the screen all day but still want structure and automation.
How to Use
Works best with bar-close execution (avoid trying to simulate intrabar fills if you want consistent behavior).
Designed for conservative, trend-aligned trading, not for hyper-scalping or news gambling.
Can be used as:
Fully automated (let all entries/exits trigger on bar close), or
Semi-automated (use alerts/signals but manually cancel some entries).
Step-by-Step: Automation with Cornix (Webhook Setup)
You can automate Super77 using Cornix by connecting TradingView alerts to your Cornix group via webhook.
Note: Exact button names may differ slightly depending on Cornix / TradingView updates, but the flow is always the same:
Cornix group → get webhook URL & mapping → TradingView alerts → signals sent to Cornix.
(Optional) Map specific pairs / directions
If you use UUID / signal mapping per symbol and per side (long/short), set them up in Cornix according to your own template.
Super77 can be used either:
On a single pair (simple setup), or
On multiple pairs if your alert / webhook structure supports that. So you can pick many pairs with 1 script.
Final Notes & Disclaimer
Super77 is an educational and experimental trading tool, not financial advice.
Past performance in back tests does not guarantee future results.
Always:
Test on demo or paper first
Adjust risk to match your own profile
Accept that losses and drawdowns are a natural part of any strategy
If you’re looking for a strategy that reflects a conservative, confirmation-based trading style with a focus on steady win rate and smoother equity behavior, Super77 was built exactly with that mindset in mind.

Disoxis Capital Club📊 Strategy B✅This indicator has been exclusively developed for Disoxis Capital Club members, combining advanced volume-weighted analytics with institutional trading concepts.
The indicator automatically resets at the start of each trading session and uses volume-weighted statistical calculations to ensure accuracy that aligns with professional trading platforms. All visual elements, including customizable color schemes and line styles, have been optimized for clarity and real-time decision-making. Designed specifically for active intraday traders within the Disoxis Capital Club community, this indicator incorporates time-based filtering capabilities and session-specific analytics to help identify high-probability trading opportunities.
The tool displays key institutional levels through clean visual representation, making it easier to recognize market behavior around volume-weighted price zones. Whether you're analyzing futures, forex, or equity markets, this indicator provides the technical foundation needed to align your trading with smart money movements and institutional order flow patterns.

Trend Vector Pro v2.0Title: Trend Vector Pro v2.0
👨💻 Developed by: Mohammed Bedaiwi
💡 Strategy Overview & Coherence
Trend Vector Pro (TVPro) is a momentum-based trend & reversal strategy that uses a custom smoothed oscillator, an optional ADX filter, and classic Pivot Points to create a single, coherent trading framework.
Instead of stacking random indicators, TVPro is built around these integrated components:
A custom momentum engine (signal generation)
An optional ADX filter (trend quality control)
Daily Pivot Points (context, targets & S/R)
Swing-based “Golden Bar” trailing stops (trade management)
Optional extended bar detection (overextension alerts)
All parts are designed to work together and are documented below to address originality & usefulness requirements.
🔍 Core Components & Justification
1. Custom Momentum Engine (Main Signal Source)
TVPro’s engine is a custom oscillator derived from the bar midpoint ( hl2 ), similar in spirit to the Awesome Oscillator but adapted and fully integrated into the strategy. It measures velocity and acceleration of price, letting the script distinguish between strong impulses, weakening trends, and pure noise.
2. ADX Filter (Trend Strength Validation – Optional)
Uses Average Directional Index (ADX) as a gatekeeper.
Why this matters: This prevents the strategy from firing signals in choppy, non-trending environments (when ADX is below the threshold) and keeps trades focused on periods of clear directional strength.
3. Classic Pivot Points (Context & Targets)
Calculates Daily Pivot Points ( PP, R1-R3, S1-S3 ) via request.security() using prior session data.
Why this matters: Momentum gives the signal, ADX validates the environment, and Pivots add external structure for risk and target planning. This is a designed interaction, not a random mashup.
🧭 Trend State Logic (5-State Bar Coloring)
The strategy uses the momentum's value + slope to define five states, turning the chart into a visual momentum map:
🟢 STRONG BULL (Bright Green): Momentum accelerating UP. → Strong upside impulse.
🌲 WEAK BULL (Dark Green): Momentum decelerating DOWN (while positive). → Pullback/pause zone.
🔴 STRONG BEAR (Bright Red): Momentum accelerating DOWN. → Strong downside impulse.
🍷 WEAK BEAR (Dark Red): Momentum decelerating UP (while negative). → Rally/short-covering zone.
🔵 NEUTRAL / CHOP (Cyan): Momentum is near zero (based on noise threshold). → Consolidation / low volatility.
🎯 Signal Logic Modes
TVPro provides two selectable entry styles, controlled by input:
Reversals Only (Cleaner Mode – Default): Targets trend flips. Entry triggers when the current state is Bullish (or Bearish) and the previous state was not. This reduces noise and over-trading.
All Strong Pulses (Aggressive Mode): Targets acceleration phases. Entry triggers when the bar turns to STRONG BULL or STRONG BEAR after any other state. This mode produces more trades.
📌 Risk Management Tools
Golden Bars – Trailing Stops: Yellow “Trail” Arrows mark confirmed Swing Highs/Lows. These are used as logical trailing stop levels based on market structure.
Extended Bars: Detects when price closes outside a 2-standard-deviation channel, flagging overextension where a pullback is more likely.
Pivot Points: Used as external targets for Take Profit and structural stop placement.
⚙️ Strategy Defaults (Crucial for Publication Compliance)
To keep backtest results realistic and in line with House Rules, TVPro is published with the following fixed default settings:
Order Size: 5% of equity per trade ( default_qty_value = 5 )
Commission: 0.04% per order ( commission_value = 0.04 )
Slippage: 2 ticks ( slippage = 2 )
Initial Capital: 10,000
📘 How to Trade with Trend Vector Pro
Entry: Take Long when a Long signal appears and confirm the bar is Green (Bull state). Short for Red (Bear state).
Stop Loss: Place the initial SL near the latest swing High/Low, or near a relevant Pivot level.
Trade Management: Follow Golden (Trail) Arrows to trail your stop behind structure.
Exits: Exit when: the trailing stop is hit, Price reaches a major Pivot level, or an opposite signal prints.
🛑 Disclaimer
This script is for educational purposes only and does not constitute financial advice. Past performance does not guarantee future results. Always forward-test and use proper risk management before applying any strategy to live trading.

Trend Vector Pro v2.0Trend Vector Pro v2.0
👨💻 Developed by: Mohammed Bedaiwi
💡 Strategy Overview & Coherence
Trend Vector Pro (TVPro) is a momentum-based trend & reversal strategy that uses a custom smoothed oscillator, an optional ADX filter, and classic Pivot Points to create a single, coherent trading framework.
Instead of stacking random indicators, TVPro is built around these integrated components:
A custom momentum engine (signal generation)
An optional ADX filter (trend quality control)
Daily Pivot Points (context, targets & S/R)
Swing-based “Golden Bar” trailing stops (trade management)
Optional extended bar detection (overextension alerts)
All parts are designed to work together and are documented below to address originality & usefulness requirements.
🔍 Core Components & Justification
1. Custom Momentum Engine (Main Signal Source)
TVPro’s engine is a custom oscillator derived from the bar midpoint ( hl2 ), similar in spirit to the Awesome Oscillator but adapted and fully integrated into the strategy. It measures velocity and acceleration of price, letting the script distinguish between strong impulses, weakening trends, and pure noise.
2. ADX Filter (Trend Strength Validation – Optional)
Uses Average Directional Index (ADX) as a gatekeeper.
Why this matters: This prevents the strategy from firing signals in choppy, non-trending environments (when ADX is below the threshold) and keeps trades focused on periods of clear directional strength.
3. Classic Pivot Points (Context & Targets)
Calculates Daily Pivot Points ( PP, R1-R3, S1-S3 ) via request.security() using prior session data.
Why this matters: Momentum gives the signal, ADX validates the environment, and Pivots add external structure for risk and target planning. This is a designed interaction, not a random mashup.
🧭 Trend State Logic (5-State Bar Coloring)
The strategy uses the momentum's value + slope to define five states, turning the chart into a visual momentum map:
🟢 STRONG BULL (Bright Green): Momentum accelerating UP. → Strong upside impulse.
🌲 WEAK BULL (Dark Green): Momentum decelerating DOWN (while positive). → Pullback/pause zone.
🔴 STRONG BEAR (Bright Red): Momentum accelerating DOWN. → Strong downside impulse.
🍷 WEAK BEAR (Dark Red): Momentum decelerating UP (while negative). → Rally/short-covering zone.
🔵 NEUTRAL / CHOP (Cyan): Momentum is near zero (based on noise threshold). → Consolidation / low volatility.
🎯 Signal Logic Modes
TVPro provides two selectable entry styles, controlled by input:
Reversals Only (Cleaner Mode – Default): Targets trend flips. Entry triggers when the current state is Bullish (or Bearish) and the previous state was not. This reduces noise and over-trading.
All Strong Pulses (Aggressive Mode): Targets acceleration phases. Entry triggers when the bar turns to STRONG BULL or STRONG BEAR after any other state. This mode produces more trades.
📌 Risk Management Tools
🟡 Golden Bars – Trailing Stops: Yellow “Trail” Arrows mark confirmed Swing Highs/Lows. These are used as logical trailing stop levels based on market structure.
Extended Bars: Detects when price closes outside a 2-standard-deviation channel, flagging overextension where a pullback is more likely.
Pivot Points: Used as external targets for Take Profit and structural stop placement.
⚙️ Strategy Defaults (Crucial for Publication Compliance)
To keep backtest results realistic and in line with House Rules, TVPro is published with the following fixed default settings:
Order Size: 5% of equity per trade ( default_qty_value = 5 )
Commission: 0.04% per order ( commission_value = 0.04 )
Slippage: 2 ticks ( slippage = 2 )
Initial Capital: 10,000
📘 How to Trade with Trend Vector Pro
Entry: Take Long when a Long signal appears and confirm the bar is Green (Bull state). Short for Red (Bear state).
Stop Loss: Place the initial SL near the latest swing High/Low, or near a relevant Pivot level.
Trade Management: Follow Golden (Trail) Arrows to trail your stop behind structure.
Exits: Exit when: the trailing stop is hit, Price reaches a major Pivot level, or an opposite signal prints.
🛑 Disclaimer
This script is for educational purposes only and does not constitute financial advice. Past performance does not guarantee future results. Always forward-test and use proper risk management before applying any strategy to live trading.

Kuytrade - Super Scalping Pro V1.0📘 Strategy "Kuytrade - Super Scalping Pro"
What is this strategy?
This is a scalping trading that helps you catch quick profits from short-term price movements. It's perfect for traders who want to make multiple small wins throughout the day.
How does it work?
The strategy uses a 3-level filter system to find high-quality trading signals:
Level 1: CORE Indicators (Must Pass)
- EMA (Moving Averages): Checks if the trend is going up or down
- MACD: Confirms momentum is building in the right direction
Level 2: MOMENTUM Indicators
- RSI: Looks for oversold (ready to bounce up) or overbought (ready to drop) conditions
- Stochastic: Finds reversal points where price might change direction
Level 3: BOOST Indicators
- RSI Divergence: Spots hidden opportunities when price and momentum disagree
- Strong Candles: Identifies powerful price movements
- ATR Filter: Makes sure the market is active enough to trade
Trading Setup
Each Signal Opens 3 Orders:
Order 1: Closes at TP1 (quick small profit)
Order 2: Closes at TP2 (medium profit)
Order 3: Closes at TP3 (big profit target)
Default Settings:
TP1: 1,000 points
TP2: 1,500 points
TP3: 2,500 points
Stop Loss: 1,200 points
Lot Size: 0.01 per order (3 orders total)
Smart Features
- Trailing Stop Loss
- When TP1 hits, the Stop Loss for TP3 automatically moves to breakeven + 150 points, protecting your profit!
- Auto Asset Detection
The strategy automatically recognizes what you're trading:
- Forex pairs (EURUSD, GBPUSD, etc.)
- Gold, Silver, Platinum
- Crypto (Bitcoin, Ethereum)
- Stock Indices (US30, NASDAQ, S&P500)
Indicators:
You can enable/disable each indicator level
Mix and match to find what works for your style
Visuals:
Show/Hide TP/SL lines
Show/Hide entry boxes
Mobile view for smaller screens
When to Use This Strategy?
✅ Best for:
Active markets (London/NY sessions)
Lower timeframes (1m, 5m, 15m)
Volatile pairs with clear trends
❌ Avoid during:
Major news releases
Very quiet markets
Weekends/holidays
----------------------------------------
กลยุทธ์นี้คืออะไร?
Scalping ที่ออกแบบมาให้ช่วยทำกำไรเล็กๆ จากการเคลื่อนไหวของราคาระยะสั้น เหมาะสำหรับเทรดเดอร์ที่ต้องการทำกำไรเล็กน้อยบ่อยๆ ตลอดทั้งวัน
ทำงานยังไง?
กลยุทธ์ใช้ระบบกรองสัญญาณ 3 ระดับ เพื่อหาจุดเข้าที่มีคุณภาพสูง
Level 1: ตัวบ่งชี้หลัก (ต้องผ่าน)
- EMA (เส้นค่าเฉลี่ย): เช็คว่าเทรนด์กำลังขึ้นหรือลง
- MACD: ยืนยันว่าแรงซื้อ/ขายกำลังมาถูกทาง
Level 2: ตัวบ่งชี้โมเมนตัม
- RSI: หาจุด Oversold (ราคาถูกเกินไป พร้อมกลับตัว) หรือ Overbought (ราคาแพงเกิน พร้อมลง)
- Stochastic: หาจุดกลับตัวที่ราคาอาจจะเปลี่ยนทิศ
Level 3: ตัวบ่งชี้เสริม
- RSI Divergence: เจอโอกาสแอบแฝงเมื่อราคาและโมเมนตัมไม่สอดคล้องกัน
- Strong Candles: จับแท่งเทียนที่แรงมาก
- ATR Filter: ตรวจว่าตลาดมีความผันผวนพอจะเทรดไหม
การตั้งค่าการเทรด
แต่ละสัญญาณเปิด 3 ออเดอร์:
ออเดอร์ 1: ปิดที่ TP1 (กำไรเล็กเร็ว)
ออเดอร์ 2: ปิดที่ TP2 (กำไรกลางๆ)
ออเดอร์ 3: ปิดที่ TP3 (กำไรใหญ่)
ค่าเริ่มต้น:
TP1: 800 จุด
TP2: 1,500 จุด
TP3: 2,500 จุด
Stop Loss: 1,200 จุด
ขนาดล็อต: 0.01 ต่อออเดอร์ (รวม 3 ออเดอร์)
ฟีเจอร์พิเศษ
- Trailing Stop Loss (ขยับ SL ตาม)
- เมื่อ TP1 โดน SL ของ TP3 จะเลื่อนมาที่ราคาเข้า + 150 จุด ทำให้คุณไม่ขาดทุน!
- ตรวจจับสินทรัพย์อัตโนมัติ
กลยุทธ์จะจำคู่เงินที่คุณเทรดได้เอง:
คู่เงิน Forex (EURUSD, GBPUSD ฯลฯ)
- ทองคำ, เงิน, แพลตตินั่ม
- คริปโต (Bitcoin, Ethereum)
- ดัชนีหุ้น (US30, NASDAQ, S&P500)
แดชบอร์ดผลงาน (ล่างซ้าย)
- แสดง Win Rate แต่ละ TP
- ติดตามกำไร/ขาดทุนรวม
- แสดงสถิติทั้งหมด
แดชบอร์ดสถานะ Level (บนขวา)
สถานะตัวบ่งชี้แบบเรียลไทม์
เขียว = สัญญาณพร้อม
แดง = รอเงื่อนไข
ตั้งค่าที่ปรับได้
คุณภาพสัญญาณ:
เปิด "Strict Filter" = สัญญาณน้อยแต่คุณภาพสูง
ปิด "Strict Filter" = สัญญาณเยอะแต่อาจเสี่ยงขึ้น
ตัวบ่งชี้:
- เปิด/ปิดแต่ละ Level ได้
- ผสมผสานหาสูตรที่เหมาะกับคุณ
การแสดงผล:
- แสดง/ซ่อนเส้น TP/SL
- แสดง/ซ่อนกล่องข้อมูล Entry
- โหมดมือถือสำหรับจอเล็ก
เมื่อไหร่ควรใช้กลยุทธ์นี้?
✅ เหมาะกับ:
- ตลาดที่คึกคัก (เซสชั่นลอนดอน/นิวยอร์ก)
- ไทม์เฟรมเล็ก (1m, 5m, 15m)
- คู่เงินที่มีความผันผวนและเทรนด์ชัด
❌ หลีกเลี่ยง:
- ช่วงมีข่าวเศรษฐกิจสำคัญ
- ตลาดเงียบมาก
- วันหยุดสุดสัปดาห์

Alpha-Vector Unconstrained [GG_DOGE]
Alpha-Vector: Variance-Weighted Trend Capture Protocol
Authored by: GG_DOGE
Executive Summary
This algorithm represents the culmination of an exhaustive quantitative regression analysis, designed to exploit fat-tail distribution events in the SOL/USD cryptographic pair. By leveraging recursive historical data modeling on the 8-Hour timeframe, the strategy identifies high-probability momentum asymmetry—specifically isolating periods where directional volatility aligns with institutional order flow.
Unlike static heuristic models, this protocol utilizes a Dynamic Variance-Weighted Allocation Engine. This ensures that capital exposure is inversely correlated to market noise (entropy) while maximizing geometric compounding during high-conviction momentum phases. It essentially acts as a volatility filter, capitalizing on the statistical skew of the asset's return profile while enforcing rigorous drawdown mitigation via adaptive liquidity exits.
Key Algorithmic Features
Asymmetric Risk Architecture: The strategy deploys decoupled risk profiles for Long and Short vectors. Through backtest optimization, we have mathematically determined that bullish drift requires aggressive variance targeting, while bearish mean-reversion requires strictly constrained capital exposure to mitigate "short-squeeze" tail risks.
Volatility-Adjusted Position Sizing: Trade depth is not static. The algorithm calculates the instantaneous Average True Range (ATR) to normalize position size based on current market turbulence. This maintains a constant Risk-of-Ruin probability, regardless of price velocity.
Quantitatively Optimized Trend Filter: The entry signal is governed by a proprietary lookback period derived from computational brute-forcing of historical pivot points, designed to filter out Gaussian noise and only execute during significant structural market shifts.
Operational Guide (Strict Adherence Required)
This script comes pre-loaded with the statistically optimal parameters for the analyzed asset. No manual calibration is required.
Deployment Target:
Asset: CRYPTO:SOLUSD (Solana / US Dollar)
Timeframe: 8h (8-Hour Candle)
Exchange: Any major liquidity venue (Binance, Coinbase, Kraken, etc.)
Configuration:
Strategy Mode: Select "Long & Short" for the fully optimized protocol (captures upside momentum and hedges downside crashes).
Risk Parameters: The default values are mathematically tuned for maximum geometric growth (Highest PnL). Do not alter these unless you wish to artificially suppress the algorithm's volatility targeting.
Execution:
Capital Allocation: The logic is designed for compounding growth. It will automatically calculate the maximum lot size allowed based on your account equity, ensuring 100% capital efficiency without crossing into margin-call territory

Gyspy Bot Trade Engine - V1.2B - Strategy 12-7-25 - SignalLynxGypsy Bot Trade Engine (MK6 V1.2B) - Ultimate Strategy & Backtest
Brought to you by Signal Lynx | Automation for the Night-Shift Nation 🌙
1. Executive Summary & Architecture
Gypsy Bot (MK6 V1.2B) is not merely a strategy; it is a massive, modular Trade Engine built specifically for the TradingView Pine Script environment. While most strategies rely on a single dominant indicator (like an RSI cross or a MACD flip) to generate signals, Gypsy Bot functions as a sophisticated Consensus Algorithm.
The engine calculates data from up to 12 distinct Technical Analysis Modules simultaneously on every bar closing. It aggregates these signals into a "Vote Count" and only executes a trade entry when a user-defined threshold of concurring signals is met. This "Voting System" acts as a noise filter, requiring multiple independent mathematical models—ranging from volume flow and momentum to cyclical harmonics and trend strength—to agree on market direction before capital is committed.
Beyond entries, Gypsy Bot features a proprietary Risk Management suite called the Dump Protection Team (DPT). This logic layer operates independently of the entry modules, specifically scanning for "Moon" (Parabolic) or "Nuke" (Crash) volatility events to force-exit positions, overriding standard stops to preserve capital during Black Swan events.
2. ⚠️ The Philosophy of "Curve Fitting" (Must Read)
One must be careful when applying Gypsy Bot to new pairs or charts.
To be fully transparent: Gypsy Bot is, by definition, a very advanced curve-fitting engine. Because it grants the user granular control over 12 modules, dozens of thresholds, and specific voting requirements, it is extremely easy to "over-fit" the data. You can easily toggle switches until the backtest shows a 100% win rate, only to have the strategy fail immediately in live markets because it was tuned to historical noise rather than market structure.
To use this engine successfully, you must adopt a specific optimization mindset:
Ignore Raw Net Profit: Do not tune for the highest dollar amount. A strategy that makes $1M in the backtest but has a 40% drawdown is useless.
Prioritize Stability: Look for a high Profit Factor (1.5+), a high Percent Profitable, and a smooth equity curve.
Regular Maintenance is Mandatory: Markets shift regimes (e.g., from Bull Trend to Crab Range). Parameters that worked perfectly in 2021 may fail in 2024. Gypsy Bot settings should be reviewed and adjusted at regular intervals (e.g., quarterly) to ensure the voting logic remains aligned with current market volatility.
Timeframe Recommendations:
Gypsy Bot is optimized for High Time Frame (HTF) trend following. It generally produces the most reliable results on charts ranging from 1-Hour to 12-Hours, with the 4-Hour timeframe historically serving as the "sweet spot" for most major cryptocurrency assets.
3. The Voting Mechanism: How Entries Are Generated
The heart of the Gypsy Bot engine is the ActivateOrders input (found in the "Order Signal Modifier" settings).
The engine constantly monitors the output of all enabled Modules.
Long Votes: GoLongCount
Short Votes: GoShortCount
If you have 10 Modules enabled, and you set ActivateOrders to 7:
The engine will ONLY trigger a Buy Entry if 7 or more modules return a valid "Buy" signal on the same closed candle.
If only 6 modules agree, the trade is rejected.
This allows you to mix "Leading" indicators (Oscillators) with "Lagging" indicators (Moving Averages) to create a high-probability entry signal that requires momentum, volume, and trend to all be in alignment.
4. Technical Deep Dive: The 12 Modules
Gypsy Bot allows you to toggle the following modules On/Off individually to suit the asset you are trading.
Module 1: Modified Slope Angle (MSA)
Logic: Calculates the geometric angle of a moving average relative to the timeline.
Function: It filters out "lazy" trends. A trend is only considered valid if the slope exceeds a specific steepness threshold. This helps avoid entering trades during weak drifts that often precede a reversal.
Module 2: Correlation Trend Indicator (CTI)
Logic: Based on John Ehlers' work, this measures how closely the current price action correlates to a straight line (a perfect trend).
Function: It outputs a confidence score (-1 to 1). Gypsy Bot uses this to ensure that we are not just moving up, but moving up with high statistical correlation, reducing fake-outs.
Module 3: Ehlers Roofing Filter
Logic: A sophisticated spectral filter that combines a High-Pass filter (to remove long-term drift) with a Super Smoother (to remove high-frequency noise).
Function: It attempts to isolate the "Roof" of the price action. It is excellent at catching cyclical turning points before standard moving averages react.
Module 4: Forecast Oscillator
Logic: Uses Linear Regression forecasting to predict where price "should" be relative to where it is.
Function: When the Forecast Oscillator crosses its zero line, it indicates that the regression trend has flipped. We offer both "Aggressive" and "Conservative" calculation modes for this module.
Module 5: Chandelier ATR Stop
Logic: A volatility-based trend follower that hangs a "leash" (ATR multiple) from the highest high (for longs) or lowest low (for shorts).
Function: Used here as an entry filter. If price is above the Chandelier line, the trend is Bullish. It also includes a "Bull/Bear Qualifier" check to ensure structural support.
Module 6: Crypto Market Breadth (CMB)
Logic: This is a macro-filter. It pulls data from multiple major tickers (BTC, ETH, and Perpetual Contracts) across different exchanges.
Function: It calculates a "Market Health" percentage. If Bitcoin is rising but the rest of the market is dumping, this module can veto a trade, ensuring you don't buy into a "fake" rally driven by a single asset.
Module 7: Directional Index Convergence (DIC)
Logic: Analyzes the convergence/divergence between Fast and Slow Directional Movement indices.
Function: Identifies when trend strength is expanding. A buy signal is generated only when the positive directional movement overpowers the negative movement with expanding momentum.
Module 8: Market Thrust Indicator (MTI)
Logic: A volume-weighted breadth indicator. It uses Advance/Decline data and Up/Down Volume data.
Function: This is one of the most powerful modules. It confirms that price movement is supported by actual volume flow. We recommend using the "SSMA" (Super Smoother) MA Type for the cleanest signals on the 4H chart.
Module 9: Simple Ichimoku Cloud
Logic: Traditional Japanese trend analysis using the Tenkan-sen and Kijun-sen.
Function: Checks for a "Kumo Breakout." Price must be fully above the Cloud (for longs) or below it (for shorts). This is a classic "trend confirmation" module.
Module 10: Simple Harmonic Oscillator
Logic: Analyzes the harmonic wave properties of price action to detect cyclical tops and bottoms.
Function: Serves as a counter-trend or early-reversal detector. It tries to identify when a cycle has bottomed out (for buys) or topped out (for sells) before the main trend indicators catch up.
Module 11: HSRS Compression / Super AO
Logic: Two options in one.
HSRS: Hirashima Sugita Resistance Support. Detects volatility compression (squeezes) relative to dynamic support/resistance bands.
Super AO: A combination of the Awesome Oscillator and SuperTrend logic.
Function: Great for catching explosive moves that result from periods of low volatility (consolidation).
Module 12: Fisher Transform (MTF)
Logic: Converts price data into a Gaussian normal distribution.
Function: Identifies extreme price deviations. This module uses Multi-Timeframe (MTF) logic to look at higher-timeframe trends (e.g., looking at the Daily Fisher while trading the 4H chart) to ensure you aren't trading against the major trend.
5. Global Inhibitors (The Veto Power)
Even if 12 out of 12 modules vote "Buy," Gypsy Bot performs a final safety check using Global Inhibitors. If any of these are triggered, the trade is blocked.
Bitcoin Halving Logic:
Hardcoded dates for past and projected future Bitcoin halvings (up to 2040).
Trading is inhibited or restricted during the chaotic weeks immediately surrounding a Halving event to avoid volatility crushes.
Miner Capitulation:
Uses Hash Rate Ribbons (Moving averages of Hash Rate).
If miners are capitulating (Shutting down rigs due to unprofitability), the engine flags a "Bearish" regime and can flip logic to Short-only or flat.
ADX Filter (Flat Market Protocol):
If the Average Directional Index (ADX) is below a specific threshold (e.g., 20), the market is deemed "Flat/Choppy." The bot will refuse to open trend-following trades in a flat market.
CryptoCap Trend:
Checks the total Crypto Market Cap chart. If the broad market is in a downtrend, it can inhibit Long entries on individual altcoins.
6. Risk Management & The Dump Protection Team (DPT)
Gypsy Bot separates "Entry Logic" from "Risk Management Logic."
Dump Protection Team (DPT)
This is a specialized logic branch designed to save the account during Black Swan events.
Nuke Protection: If the DPT detects a volatility signature consistent with a flash crash, it overrides all other logic and forces an immediate exit.
Moon Protection: If a parabolic pump is detected that violates statistical probability (Bollinger deviations), DPT can force a profit take before the inevitable correction.
Advanced Adaptive Trailing Stop (AATS)
Unlike a static trailing stop (e.g., "trail by 5%"), AATS is dynamic.
Penthouse Level: If price is at the top of the HSRS channel (High Volatility), the stop loosens to allow for wicks.
Dungeon Level: If price is compressed at the bottom, the stop tightens to protect capital.
Staged Take Profits
TP1: Scalp a portion (e.g., 10%) to cover fees and secure a win.
TP2: Take the bulk of profit.
TP3: Leave a "Runner" position with a loose trailing stop to catch "Moon" moves.
7. Recommended Setup Guide
When applying Gypsy Bot to a new chart, follow this sequence:
Set Timeframe: 4 Hours (4H).
Reset: Turn OFF Trailing Stop, Stop Loss, and Take Profits. (We want to see raw entry performance first).
Tune DPT: Adjust "Dump/Moon Protection" inputs first. These have the highest impact on net performance.
Tune Module 8 (MTI): This module is a heavy filter. Experiment with the MA Type (SSMA is recommended).
Select Modules: Enable/Disable modules 1-12 based on the asset's personality (Trending vs. Ranging).
Voting Threshold: Adjust ActivateOrders. A lower number = More Trades (Aggressive). A higher number = Fewer, higher conviction trades (Conservative).
Final Polish: Re-enable Stop Losses, Trailing Stops, and Staged Take Profits to smooth the equity curve and define your max risk per trade.
8. Technical Specs
Engine Version: Pine Script V6
Repainting: This strategy uses Closed Candle data for all Risk Management and Entry decisions. This ensures that Backtest results align closely with real-time behavior (no repainting of historical signals).
Alerts: This script generates Strategy alerts. If you require visual-only alerts, see the source code header for instructions on switching to "Study" (Indicator) mode.
Disclaimer:
This script is a complex algorithmic tool for market analysis. Past performance is not indicative of future results. Use this tool to assist your own decision-making, not to replace it.
9. About Signal Lynx
Automation for the Night-Shift Nation 🌙
Signal Lynx focuses on helping traders and developers bridge the gap between indicator logic and real-world automation. The same RM engine you see here powers multiple internal systems and templates, including other public scripts like the Super-AO Strategy with Advanced Risk Management.
We provide this code open source under the Mozilla Public License 2.0 (MPL-2.0) to:
Demonstrate how Adaptive Logic and structured Risk Management can outperform static, one-layer indicators
Give Pine Script users a battle-tested RM backbone they can reuse, remix, and extend
If you are looking to automate your TradingView strategies, route signals to exchanges, or simply want safer, smarter strategy structures, please keep Signal Lynx in your search.
License: Mozilla Public License 2.0 (Open Source).
If you make beneficial modifications, please consider releasing them back to the community so everyone can benefit.

Profitable Pair Correlation Divergence Scanner v6This strategy identifies divergence opportunities between two correlated assets using a combination of Z-Score spread analysis, trend confirmation, RSI & MACD momentum checks, correlation filters, and ATR-based stop-loss/take-profit management. It’s optimized for positive P&L and realistic trade execution.
Key Features:
Pair Divergence Detection:
Measures deviation between returns of two assets and identifies overbought/oversold spread conditions using Z-Score.
Trend Alignment:
Trades only in the direction of the primary asset’s trend using a fast EMA vs slow EMA filter.
Momentum Confirmation:
Confirms trades with RSI and MACD to reduce false signals.
Correlation Filter:
Ensures the pair is strongly correlated before taking trades, avoiding noisy signals.
Risk Management:
Dynamic ATR-based stop-loss and take-profit ensures proper reward-to-risk ratio.
Exit Conditions:
Automatically closes positions when Z-Score normalizes, or ATR-based exits are hit.
How It Works:
Calculate Returns:
Computes returns for both assets over the selected timeframe.
Z-Score Spread:
Calculates the spread between returns and normalizes it using moving average and standard deviation.
Trend Filter:
Only takes long trades if the fast EMA is above the slow EMA, and short trades if the fast EMA is below the slow EMA.
Momentum Confirmation:
Confirms trade direction with RSI (>50 for longs, <50 for shorts) and MACD alignment.
Correlation Check:
Ensures the pair’s recent correlation is strong enough to validate divergence signals.
Trade Execution:
Opens positions when Z-Score crosses thresholds and all conditions align. Positions close when Z-Score normalizes or ATR-based SL/TP is hit.
Plot Explanation:
Z-Score: Blue line shows divergence magnitude.
Entry Levels: Red/Green lines mark long/short thresholds.
Exit Zone: Gray lines show normalization zone.
EMA Trend Lines: Purple (fast), Orange (slow) for trend alignment.
Correlation: Teal overlay shows current correlation strength.
Usage Tips:
Use highly correlated pairs for best results (e.g., EURUSD/GBPUSD).
Run on higher timeframe charts (1h or 4h) to reduce noise.
Adjust ATR multiplier based on volatility to avoid premature stops.
Combine with alerts for automated notifications or webhook execution.
Conclusion:
The Profitable Pair Correlation Divergence Scanner v6 is designed for traders who want systematic, low-risk, positive P&L trading opportunities with minimal manual monitoring. By combining trend alignment, momentum confirmation, correlation filters, and dynamic exits, it reduces false signals and improves execution reliability.
Run it on TradingView and watch how it captures divergence opportunities while maintaining positive P&L across trades.

Momentum Reversal / Dip Buyer [Score Based]Strategy Overview
Momentum Reversal / Dip Buyer is a quantitative reversal engine designed to fade stretched moves and buy dips / sell rallies when multiple momentum and context factors line up. It’s built for liquid instruments especially for ticker CME_MINI:ES1! and works best on intraday timeframes like the 5-minute or 1-minute chart.
Core Logic
This strategy builds a composite Momentum Score by combining:
Price Location: Relative to 100 SMA, 1000 EMA, and VWAP (trend / regime filter).
RSI: Overbought/oversold and mid-zone strength.
VWMO (Volume-Weighted Momentum): Direction and strength of volume-weighted price drift.
ADX: Trend strength filter (high vs low trend environment).
Full Stoch (%K): Short-term exhaustion and mean-reversion context.
CCI: Overbought/oversold turns (key trigger).
MFI: Volume-confirmed buying/selling pressure.
ATR Regime: High vs low volatility environment.
Cumulative Delta: Whether net aggressor flow is rising or falling.
From this, a single Momentum Score is computed each bar:
Longs: Taken when the score is depressed (scoreLow) and CCI crosses up from oversold.
Shorts: Taken when the score is elevated (scoreHigh) and CCI crosses down from overbought.
Risk Management & Trade Logic
Max Daily Trades: Hard cap on entries per day.
Hard Stop: Fixed % stop based on entry price.
Profit Target: Target ATR Multiplier × main ATR from entry.
Breakeven Logic: Optional; moves stop to breakeven (plus optional offset) after price moves a configurable multiple of the main ATR in your favor.
Trailing Stop (Separate ATR): Optional; uses its own ATR length and ATR-based trigger and distance. This lets you run slower ATR for targets while using a tighter, more reactive ATR for the trail.
Session Control
Trading Window: Optional session filter (e.g., 09:30–16:00). Entries are only allowed inside the defined window.
Force Flat at Session End: Option to automatically close all open positions when the session ends.
Visuals
The script plots entry arrows and a compact dashboard displaying: current Momentum Score, daily trade usage, and CCI status.
Disclaimer:
This script is for educational and research purposes only and is not financial advice. Past performance does not guarantee future results. Always forward-test and adjust parameters to your own risk tolerance and market.
Shoutout and all credit goes to AuclairsCapital for building the base foundation of this strategy on ThinkScript

Bollinger Bands Mean Reversion using RSI [Krishna Peri]How it Works
Long entries trigger when:
- RSI reaches oversold levels, and
- At least one bullish candle closes inside the lower Bollinger Band
Short entries trigger when:
- RSI reaches overbought levels, and
- At least one bearish candle closes inside the upper Bollinger Band
This approach aims to capture exhaustion moves where price pushes into extreme deviation from its mean and then snaps back toward the middle band.
Important Disclaimer
This is a mean-reversion strategy, which means it performs best in sideways, ranging, or slowly oscillating market conditions. When markets shift into strong trends, Bollinger Bands expand and volatility increases, which may cause some signals to become inaccurate or fail altogether.
For best results, combine this script with:
- Price action
- Market structure
- Higher-timeframe trend context
- Previous day/week/month highs & lows
- Untested liquidity levels or imbalance zones
- Session timing (Asia, London, NY)
Using these confluences helps filter out low-probability trades and significantly improves consistency and precision.

Sniper Perfect: Institutional Flow & Adaptive Risk ProtocolOverview Sniper Perfect is an advanced trend-following system designed to filter out "fakeouts" and institutional traps using a multi-layered verification protocol. It combines Volume Flow (VFI), Volatility (CHOP), and Momentum (RSI) to ensure entry only occurs in high-probability setups.
Key Features
🛡️ The Triple Filter Protocol
Strict Choppiness Filter: Uses a strict CHOP threshold (40). If the market is moving sideways, the algorithm locks all new entries to prevent whipsaws.
RSI Extremes Protection: Prevents FOMO buying at tops (Overbought > 70) and panic selling at bottoms (Oversold < 30).
Conflict Zone Detection: Identifies divergence between Price action and Money Flow. If price rises but institutional money exits, the background turns Gray and trading is disabled.
🔒 Adaptive Risk Management
Heat-Breathing Stop Loss: The SL distance adjusts dynamically based on market Volume and Volatility ("Heat").
Ratchet Mechanism: A mechanical lock ensures the Stop Loss can ONLY move in the direction of profit. It never loosens, guaranteeing that paper profits are protected.
📊 Live Dashboard A real-time panel in the bottom-right corner displays:
VFI Flow: Positive/Negative money flow.
Market Status: Active vs. Locked (Choppy).
RSI Status: Neutral, Overbought, or Oversold.
Visual Guide
🟢 Lime Zone: Clean Bullish Trend.
🔴 Red Zone: Clean Bearish Trend.
🟠 Orange Zone: High Choppiness (Stay Out).
🟣 'X' Marker: Exact price where the Stop Loss was triggered.
Disclaimer: For educational and research purposes only. Always manage your risk.

Sniper PerfectOverview Sniper Perfect is an advanced trend-following system designed to filter out "fakeouts" and institutional traps using a multi-layered verification protocol. It combines Volume Flow (VFI), Volatility (CHOP), and Momentum (RSI) to ensure entry only occurs in high-probability setups.
Key Features
🛡️ The Triple Filter Protocol
Strict Choppiness Filter: Uses a strict CHOP threshold (40). If the market is moving sideways, the algorithm locks all new entries to prevent whipsaws.
RSI Extremes Protection: Prevents FOMO buying at tops (Overbought > 70) and panic selling at bottoms (Oversold < 30).
Conflict Zone Detection: Identifies divergence between Price action and Money Flow. If price rises but institutional money exits, the background turns Gray and trading is disabled.
🔒 Adaptive Risk Management
Heat-Breathing Stop Loss: The SL distance adjusts dynamically based on market Volume and Volatility ("Heat").
Ratchet Mechanism: A mechanical lock ensures the Stop Loss can ONLY move in the direction of profit. It never loosens, guaranteeing that paper profits are protected.
📊 Live Dashboard A real-time panel in the bottom-right corner displays:
VFI Flow: Positive/Negative money flow.
Market Status: Active vs. Locked (Choppy).
RSI Status: Neutral, Overbought, or Oversold.
Visual Guide
🟢 Lime Zone: Clean Bullish Trend.
🔴 Red Zone: Clean Bearish Trend.
🟠 Orange Zone: High Choppiness (Stay Out).
🟣 'X' Marker: Exact price where the Stop Loss was triggered.
Disclaimer: For educational and research purposes only. Always manage your risk.

The Truth Sniper: Breathing Edition**Overview**
This is a highly advanced trend-following strategy designed to filter out market noise ("Fakeouts") and manage risk using a dynamic "Breathing Ratchet" mechanism. It combines traditional trend analysis with institutional money flow logic to identify the true market direction.
**Key Features**
**1. The Conflict Zone (Gray Zone Filter)**
Most strategies fail during low-volume accumulation or distribution phases. This algorithm introduces a "Conflict Zone" logic:
* **True Rally (Green):** Price is above EMA50 AND Money Flow (VFI) is positive.
* **True Drop (Red):** Price is below EMA50 AND Money Flow (VFI) is negative.
* **Conflict (Gray Background):** When Price and Money Flow disagree (e.g., Price rising on negative volume), the background turns Gray. **Trading is disabled** in these zones to avoid bull/bear traps.
**2. Breathing Stop-Loss Mechanism (Volatility Adjusted)**
The Stop Loss isn't static. It "breathes" based on market heat (Volume/RSI):
* **High Heat (High Volatility):** The SL loosens its grip, moving towards the bottom of the Fibonacci zone to allow price fluctuation without premature exits.
* **Low Heat (Low Volatility):** The SL tightens aggressively towards the price to lock in profits during slow momentum.
**3. The Ratchet Lock (Slippage Prevention)**
To ensure maximum profit retention, the "Breathing" mechanism is governed by a **Ratchet Logic**:
* **For Longs:** The Stop Loss can ONLY move UP. If the "Breathing" calculation suggests lowering the stop (due to increased volatility), the Ratchet blocks it, keeping the SL at the highest historical level.
* **For Shorts:** The Stop Loss can ONLY move DOWN.
**4. Fibonacci Exit Zones**
Exits are calculated based on a 60-day dynamic High/Low lookback, creating "Zones" (0-23.6%, 23.6-38.2%, etc.) that the price must conquer. The SL trails these zones mechanically.
**Visual Guide**
* **Lime/Red Background:** Active Trade Zone (Confirmed Trend).
* **Gray Background:** Conflict Zone (Stay Out / Hold).
* **Purple 'X':** The exact price level where the Stop Loss was hit (Fixed marker).
* **Stepline:** The active Stop Loss level (Visible only during open trades).
**Disclaimer**
This script is for educational and research purposes only. Always manage your risk.

XRP Non-Stop Strategy (TP 25% / SL 15%)This strategy performs continuous automated trading exclusively on XRP. It opens long positions during favorable trend conditions, using a fixed Take Profit target of 25% above the entry price and a fixed Stop Loss of 15% below the entry. Once a trade is closed (either TP or SL), the strategy automatically re-enters on the next valid signal, enabling uninterrupted trading.
The script includes:
Dynamic Take Profit & Stop Loss lines
Optional EMA trend filter
Visual BUY and EXIT markers
TradingView alerts for automation or notifications
This strategy is built for traders who want a simple, price-action-driven system without fixed price levels, relying only on percentage-based movement from each entry.

RSI Risk | AlgoFy TraderRSI Risk | AlgoFy Trader
Overview
The RSI Risk | AlgoFy Trader is a trading system that combines RSI-based entry signals with automated capital management. This strategy identifies potential momentum shifts while controlling risk through calculated position sizing.
Key Features
Dynamic Risk Management:
Fixed Risk Per Trade: Users set maximum risk percentage per trade.
Automatic Position Sizing: Calculates position size based on stop-loss distance.
Capital Protection: Limits each trade's risk to user-defined percentage.
RSI Entry System:
Momentum Detection: Uses RSI crossovers above/below defined thresholds.
Clear Signals: Provides long/short entries on momentum transitions.
Multiple Exit Layers:
Dynamic Stop Loss: Stop based on recent price structure.
Fixed Safety Stop: Optional percentage-based stop loss.
Partial Take Profit: Optional early profit-taking.
Trailing Stop: Optional dynamic profit protection.
Performance Tracking:
Trade Statistics: Tracks win/loss streaks and performance metrics.
Monthly Dashboard: Shows monthly/yearly P&L with equity views.
Trade Details: Displays risk percentage and position size.
How It Works
Signal Detection: Monitors RSI for crossover events.
Risk Calculation: Determines stop-loss based on recent volatility.
Position Sizing: Calculates exact position to match risk percentage.
Example:
Account: $10,000 | Risk: 2% ($200 max)
Stop loss at 4% distance
Position size: $5,000
Result: 4% loss on $5,000 = $200 (2% of account)
Recommended Settings
Risk: 1-2% per trade
Enable fixed stop at 3-4%
Consider trailing stop activation
This script provides disciplined RSI trading with automated risk control, adjusting exposure while maintaining strict risk limits.

