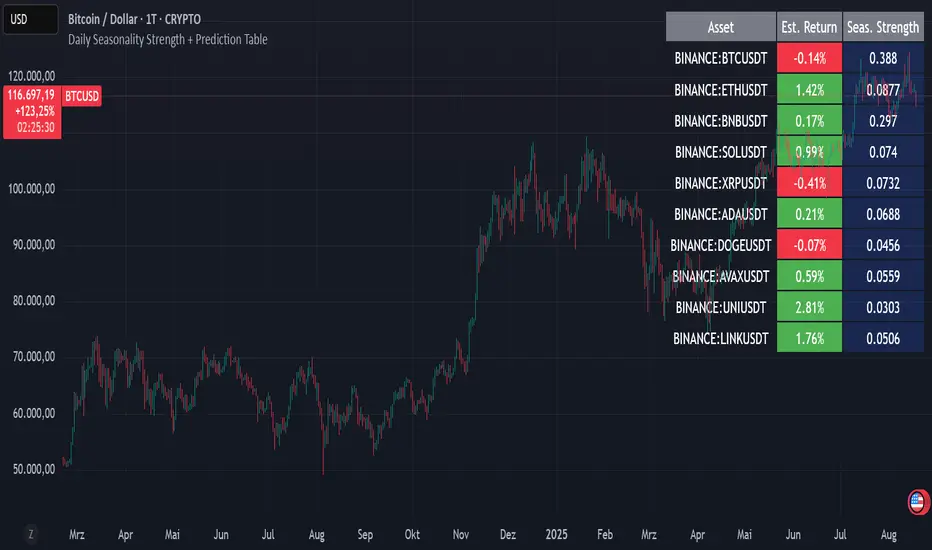
Yearly Projection ExplorerThis indicator helps you understand how the current market period has behaved historically by overlaying the same date window from previous years and projecting it forward from today’s price.
The script works the following way:
Aligns past years to today’s calendar date
Normalizes all paths to the last close at the start
Projects historical performance X bars forward
Displays each year as a separate performance path
Calculates and plots the mean (average) projection for quick reference
🔧 How It Works
Number of Years: choose how many past years to include (e.g. last 10, 20, or 25 years)
Projection Length: choose how many bars (days) ahead to project
Each line shows how the market moved during the same period in a specific year
Labels show the year and total return at the projection end
The mean line highlights the average historical outcome
🧠 Why This Is Useful
Identify seasonal tendencies
Compare current price action to historical analogs
Visualize best / worst historical outcomes
Set realistic expectations for short-term moves
Add context to discretionary or systematic decisions
This tool does not predict the future, but it provides a powerful historical framework to assess what has been typical, rare, or extreme for the current market window.
⚠️ Notes
Script works on timenow variable for now, and you might see unexpected periods if today is a day off.
Results depend on the selected timeframe and instrument
Past performance is not a guarantee of future results
Designed for analysis and context, not standalone signals
אינדיקטור Pine Script®