Concept Dual SuperTrendSimple SuperTrend indicator giving you the option to display two SuperTrends on a single script plus additional customization features. Dual setup inspired by Income Sharks 🦈אינדיקטור Pine Script®מאת Concept21111406
Supertrend+4moving by pejmantak123for free users: stop loss trailing and moving average can be use together for best entering and exit position Supertrend+4moving by pejmantak123אינדיקטור Pine Script®מאת pejmantak123מעודכן 11182
SuperTrend OptimizerHello! This indicator attempts to optimize Supertrend parameters. To achieve this, 102 parameter combinations are tested concurrently - the top three performers are listed in descending order. Parameters, Factor: Changes to this parameter shifts the tested factor range. For instance, increasing the factor measure from 3.00 to 3.01 (+0.01) will remove 3.00 from the tested range - this setting controls the lower threshold of the range. The upper threshold, in all instances, is the lower Factor threshold + 3.3 (i.e. 3.0(lower) - 6.3(upper), 4.0(lower) - 7.3(upper), 2.5(lower) - 5.8(upper)) ATR period: Changes to this parameter shifts the tested ATR period range. For instance, increasing the ATR measure from 10 to 11 (+1) will remove 10 from the tested range - this setting controls the lower threshold of the range. The upper threshold, in all instances, is the lower threshold + 2 (i.e. 10(lower) - 12(upper), 11(lower) - 13(upper), 9(lower), - 11(upper)) The Factor parameter is modifiable to any positive decimal number; the ATR parameter is modifiable to any positive integer. Changing either parameter shifts the tested parameter combination range. Both parameters can be changed in the settings, to which you control the lower threshold of the range. If, for instance, you were to change the Factor measurement from 3.0 to 4.1 (+1.1) the 4.0 Factor measurement, and all Factor measures less than 4.0, will be excluded from the performance test. Consequently, a Supertrend test will be performed with a Factor of 4.1 and an ATR period of 10 (default). This test repeats at 0.1 Factor intervals and 1.0 ATR intervals. Therefore, assume you modify the Factor lower threshold to 3.1 and the ATR lower threshold to 10. The indicator will test three Supertrend systems with a Factor of 3.1 and an ATR period of 10.. then 11.. 12, then three systems with a Factor of 3.2 and an ATR period of 10.. then 11.. 12... until (lower Factor threshold + 3.3) and (lower ATR threshold + 2) are tested... which in this example is... a Factor of 6.4 and an ATR period of 12. The tested Factor range and ATR range are displayed in a bottom right table alongside the top performing parameter combinations. Of course, you can change the the lower thresholds, which means you can test numerous Supertrend parameter combinations! However, no greater than 102 parameter combinations will be tested simultaneously; the best performing Supertrend parameters are plotted on the chart automatically. I will be working on this indicator more tomorrow! Let me know if you have questions or anything you would like included! (I of course added something fun in the script. Be sure to try it with bar replay!) אינדיקטור Pine Script®מאת KioseffTradingמעודכן 7171 2.9 K
SuperTrendSHey! By using this script you can choose between the Regular SuperTrend and Pivot Point SuperTrend. Pivot Point SuperTrend differs in calculation from the regular SuperTrend and as the name suggests, Pivot Points are used instead of ATR. I made this script to make it easier to switch and compare between one another. Also included Jurik RSX as a Momentum Indicator. SuperTrend changes color to purple when it's a bear trend and RSX is in an overbought state. And orange when it's a bull trend and RSX is in an oversold state. A reversal might be expected when color changes to purple & orange occur. Special thanks to; Kivanc Ozbilgic for SuperTrend LonesomeTheBlue for Pivot Point SuperTrend & everget for Jurik RSX Enjoy! אינדיקטור Pine Script®מאת lucidreamer15מעודכן 575
SuperIchi [LuxAlgo]Using one indicator as the core for another one to improve certain aspects while offering an alternative user interaction can be very interesting in technical analysis. This indicator is a modification of the popular Ichimoku indicator using the equally popular Supertrend indicator as its core, thus no longer entirely relying on calculations done over a fixed window size but instead relying on the average true range and the trend detection method offered by the Supertrend. Settings Tenkan: Atr length (left) and factor (right) used for the Supertrend involved in the calculations of the Tenkan Ichimoku component Kijun: Atr length (left) and factor (right) used for the Supertrend involved in the calculations of the Kijun Ichimoku component Senkou Span B: Atr length (left) and factor (right) used for the Supertrend involved in the calculations of the second Senkou Span Ichimoku component Displacement: Bar offset of the cloud (positive offset) and Chikou (negative offset) Usage The SuperIchi indicator can be interpreted similarly to a regular Ichimoku as it retains the components and aspects from this one. Users can make use of the Supertrend Factor to detect shorter or longer-term trends. Unlike the regular components of the Ichimoku based on rolling maximums/minimums, using the Supertrend here allows smoother components and makes it less prone to whipsaw signals. Note that the Chikou is disabled by default in the style settings Details The original Ichimoku indicator is constructed from the average between the rolling maximum high and minimum low values. The Supertrend indicator also relies on one upper/lower extremity but using the average of these extremities for the modification of the Ichimoku indicator might not provide easy to use results due to the nature of these extremities. Instead, we compute the average between the Supertrend and trailing maximums/minimums with a value reset when a new trend is detected by the Supertrend. This allows obtaining a result that is closer to the original average used by Ichimoku.אינדיקטור Pine Script®מאת LuxAlgo4545 3.8 K
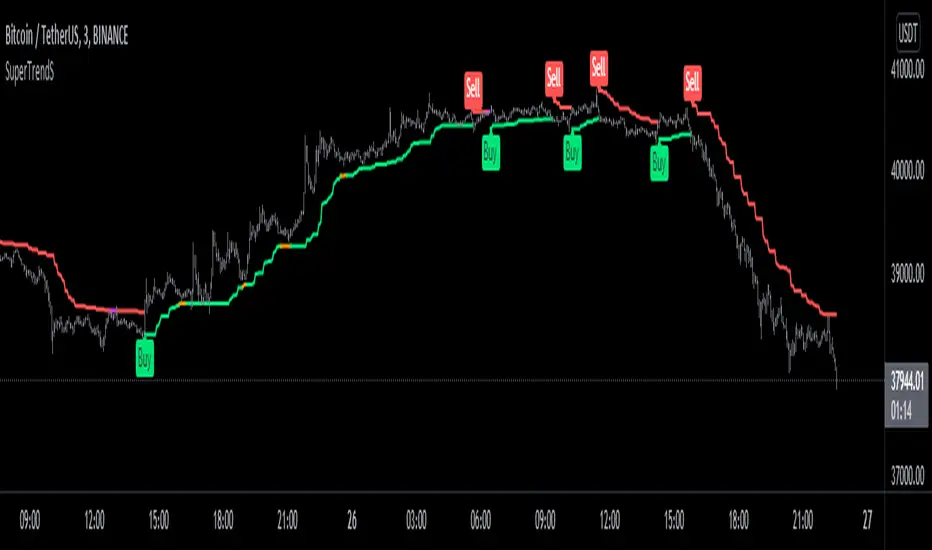
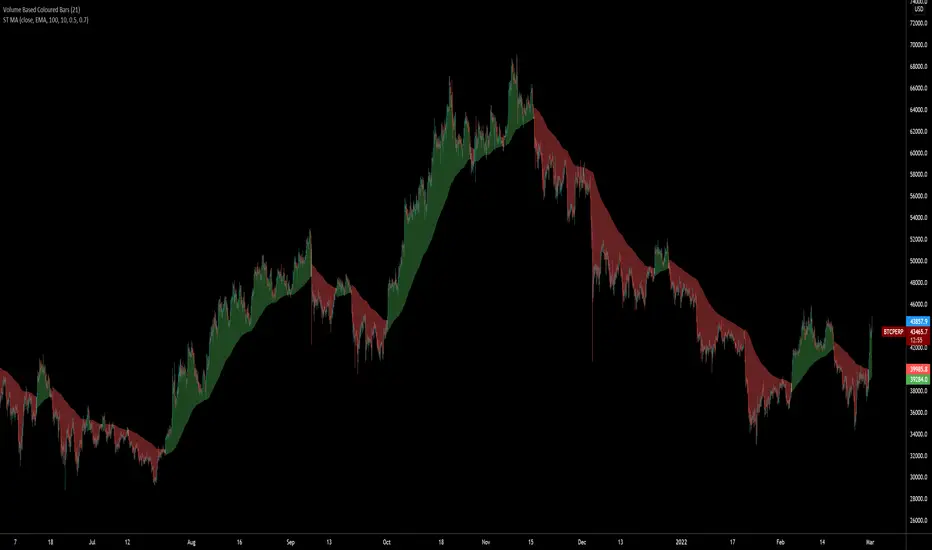
SuperTrended Moving AveragesA different approach to SuperTrend: adding 100 periods Exponential Moving Average in calculation of SuperTrend and also 0.5 ATR Multiplier to have a clear view of the ongoing trend and also provides significant Supports and Resistances. Default Moving Average type set as EMA (Exponential Moving Average) but users can choose from 11 different Moving Average types as: SMA : Simple Moving Average EMA : Exponential Moving Average WMA : Weighted Moving Average DEMA : Double Exponential Moving Average TMA : Triangular Moving Average VAR : Variable Index Dynamic Moving Average a.k.a. VIDYA WWMA : Welles Wilder's Moving Average ZLEMA : Zero Lag Exponential Moving Average TSF : True Strength Force HULL : Hull Moving Average TILL : Tillson T3 Moving Average Credits going to @CryptoErge for sharing his development to public.אינדיקטור Pine Script®מאת KivancOzbilgicמעודכן 9393 10 K
Compound Indicator Strategy - BTC/USDT 3hThis is an Strategy finds and utilise end points of short term market trends and this is a combination of many indicators such as 1. Volume change oscillator 2. Money flow index ( MFI ) 3. Momentum Oscillator (MOM) 4. Stochastic Indicator 6. Relative Strength Indicator ( RSI ) 7. Relative volatility index (RVI) 8. Balance of power (BOP) 9. Small moving average ( SMA ) 10. Exponential moving average ( EMA ) 11. Parabolic SAR 12. Super trend indicator this script forms a compound indicator after analysing movements of those indicators through different time frames and measure its co-relation and variance with the price action. buy doing that, indicator in a position to identify short term market reversals and presented. after generating a common indicator, it evaluates standard deviation and standard variance with currant market price action and generates a buy and sell signals. you can determine your own trading method based on available options. אסטרטגיית Pine Script®מאת pcooma44314
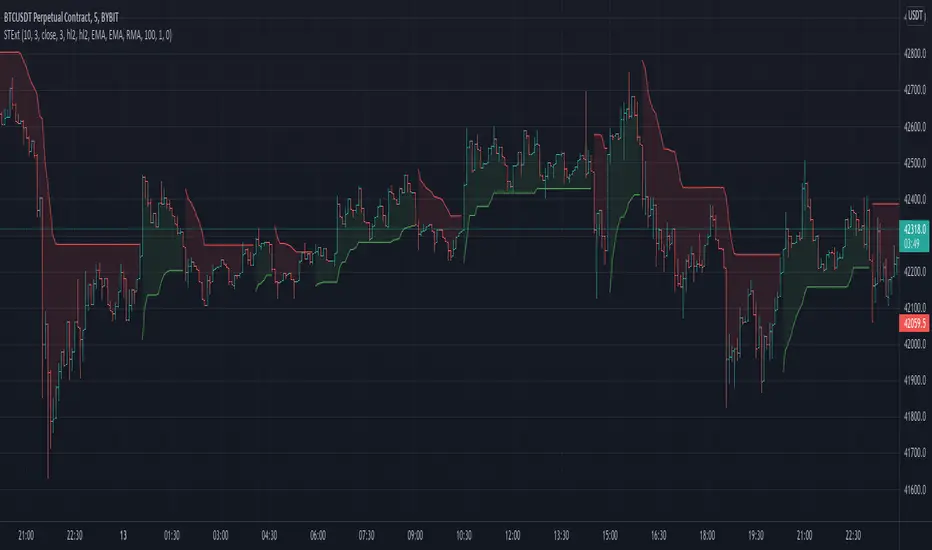
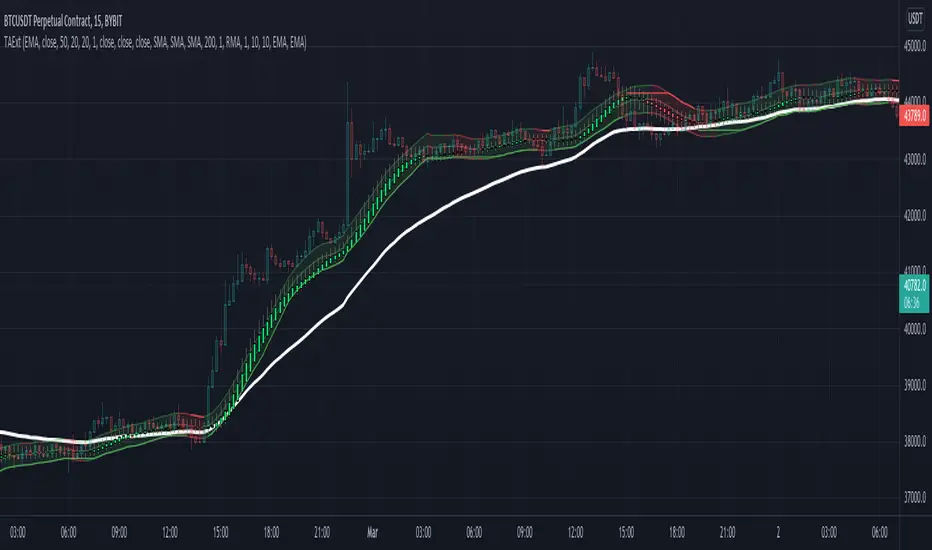
Supertrend Ext1st it exactly looks like the original Supertrend indicator. But if you see the options, you can see it is totally different: It uses my other indicator inside: Zero Lag Keltner Channels, so you can use smoothed ATR bands for calculation instead of the raw ATR. By default it's length is 1 so it works like the original Supertrend. You can choose different sources and moving averages for Keltner Channel calculation It can filter outliers in ATR calculation The indicator code is in my TAExt library, so it can easily be used in custom strategies. אינדיקטור Pine Script®מאת TheBacktestGuyמעודכן 33103
Acrypto - Weighted StrategyHello traders! I have been developing a fully customizable algo over the last year. The algorithm is based on a set of different strategies, each with its own weight (weighted strategy). The set of strategies that I currently use are 5: MACD Stochastic RSI RSI Supertrend MA crossover Moreover, the algo includes STOP losses criteria and a taking profit strategy. The algo must be optimized for the desired asset to achieves its full potential. The 1H and 4H dataframe give good results. The algo has been tested for several asset (same dataframe, different optimization values). Important note: Backtest the algorithm with different data stamps to avoid overfitting results Best, Albertoאסטרטגיית Pine Script®מאת accryמעודכן 203203 3.4 K
Compound IndicatorThis is an indicator finds end points of short term market trends. this is a combination of many indicators such as 1. Volume change oscillator 2. Money flow index (MFI) 3. Momentum Oscillator (MOM) 4. Stochastic Indicator 6. Relative Strength Indicator (RSI) 7. Relative volatility index (RVI) 8. Balance of power (BOP) 9. Small moving average (SMA) 10. Exponential moving average (EMA) 11. Parabolic SAR 12. Super trend indicator this script forms a compound indicator after analysing movements of those indicators through different time frames and measure its co-relation and variance with the price action. buy doing that, indicator in a position to identify short term market reversals and presented.אינדיקטור Pine Script®מאת pcooma6655
TAExtLibrary "TAExt" Indicator functions can be used in other indicators and strategies. This will be extended by time with indicators I use in my strategies and studies. atrwo(length, stdev_length, stdev_mult) ATR without outliers Parameters: length : The length of the ATR stdev_length : The length of the standard deviation, used for detecting outliers stdev_mult : The multiplier of the standard deviation, used for detecting outliers Returns: The ATR value atrwma(src, period, type, atr_length, stdev_length, stdev_mult) ATR without outlier weighted moving average Parameters: src : The source of the moving average period : The period of the moving average type : The type of the moving average, possible values: SMA, EMA, RMA atr_length : The length of the ATR stdev_length : The length of the standard deviation, used for detecting outliers stdev_mult : The multiplier of the standard deviation, used for detecting outliers Returns: The moving average value jma(src, period, phase, power) Jurik Moving Average Parameters: src : The source of the moving average period : The period of the moving average calculation phase : The phase of jurik MA calculation (-100..100) power : The power of jurik MA calculation Returns: The Jurik MA series anyma(src, period, type, offset, sigma, phase, power) Moving Average by type Parameters: src : The source of the moving average period : The period of the moving average calculation type : The type of the moving average offset : Used only by ALMA, it is the ALMA offset sigma : Used only by ALMA, it is the ALMA sigma phase : The phase of jurik MA calculation (-100..100) power : The power of jurik MA calculation Returns: The moving average series wae(macd_src, macd_fast_length, macd_slow_length, macd_sensitivity, bb_base_src, bb_upper_src, bb_lower_src, bb_length, bb_mult, dead_zone_length, dead_zone_mult) Waddah Attar Explosion (WAE) Parameters: macd_src : The source series used by MACD macd_fast_length : The fast MA length of the MACD macd_slow_length : The slow MA length of the MACD macd_sensitivity : The MACD diff multiplier bb_base_src : The source used by stdev bb_upper_src : The source used by the upper Bollinger Band bb_lower_src : The source used by the lower Bollinger Band bb_length : The lenth for Bollinger Bands bb_mult : The multiplier for Bollinger Bands dead_zone_length : The ATR length for dead zone calculation dead_zone_mult : The ATR multiplier for dead zone Returns: ssl(length, high_src, low_src) Semaphore Signal Level channel (SSL) Parameters: length : The length of the moving average high_src : Source of the high moving average low_src : Source of the low moving average Returns: adx(atr_length, di_length, adx_length, high_src, low_src, atr_ma_type, di_ma_type, adx_ma_type) Average Directional Index + Direction Movement Index (ADX + DMI) Parameters: atr_length : The length of ATR di_length : DI plus and minus smoothing length adx_length : ADX smoothing length high_src : Source of the high moving average low_src : Source of the low moving average atr_ma_type : MA type of the ATR calculation di_ma_type : MA type of the DI calculation adx_ma_type : MA type of the ADX calculation Returns: ספריית Pine Script®מאת TheBacktestGuyמעודכן 99150
Supertrend Explorer Second_40This is the second batch of 40 BIST Stocks, following up the first_40אינדיקטור Pine Script®מאת taner744116
Supertrend Explorer First_40This indicator was brought by Kıvanç Özbilgiç. I only modified it to search for 40 stocks on BIST. The other stocks are listed as Second_40, Third_40 and Fourth_40.אינדיקטור Pine Script®מאת taner71176
Supertrend StrategyThis Supertrend strategy will allow you to enter a long or short from a supertrend trend change. Both ATR period and ATR multiplier are adjustable. If you check off "Change ATR Calculation Method" it will base the calculation off the sma and give you slightly different results, which may work better depending on the asset. Be sure to enter slippage and commission into the properties to give you realistic results. I've also built in backtesting date ranges and the ability to trade only within certain times of day and have it close all trades at the end of that time frame. This is especially useful for day trading stocks. If you check off "Enter First Trade ASAP" then when using the time frame option it will enter the current trade. If however you uncheck that box and instead check off "Wait To Enter First Trade" it will wait for the trend to change and then enter. You can also specify a % based take profit and stop loss. In most cases the stop loss is not needed because of the atr based stop that supertrend provides so you could check only take profit and see if it works best to take profit or to let supertrend trend change get you out. Also keep in mind that if you have "Enter First Trade ASAP" checked off and use the stop loss and/or take profit then it will re-enter the current trend again. Finally there's custom alert fields so you can send custom alert messages for strategy entry and exit for use with automated trading services. Simply enter your messages in the fields within the strategy properties and then put {{strategy.order.alert_message}} in your alert message body and it will dynamically pull in the appropriate message.אסטרטגיית Pine Script®מאת REV0LUTI0Nמעודכן 66294
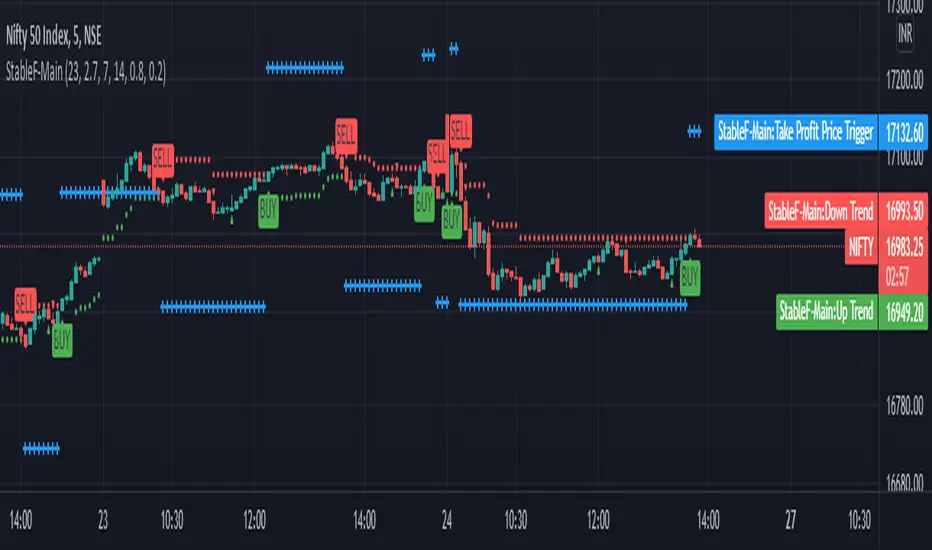
StableF-MainIt is combination of Built in Super trend and Adx with take profit uptrend is considered when +dmi is above -dmi and +dmi is above 25 and adx is above 25 and supertrend gives Buy downtrend is considered when -dmi is above +dmi and -dmi is above 25 and adx is above 25 and supertrend give sell use fibo for target by taking as previous swing high and swing low -supertrend crossover is referred as buy plotshape -supertrend cross under is referred as Sell plotshape -keep stoploss at dot line of supertrend -adx-dmi crossover (+dmi crossed above -dmi) is shown by Triangle Up symbol -adx-dmi crossunder( -dmi crosses below +dmi) is shown by Triangle down symbol --Cross symbol with blue line with linewidth 2 is referred as Take profit --combine this with adx -dmi setting with 7 and 14 ----disclaimer----- used free built in supertrend and adx so u can use same setting in other broker or in trading view not responsible for any loss or gain -only for educational purpose אינדיקטור Pine Script®מאת E-Nifty22252
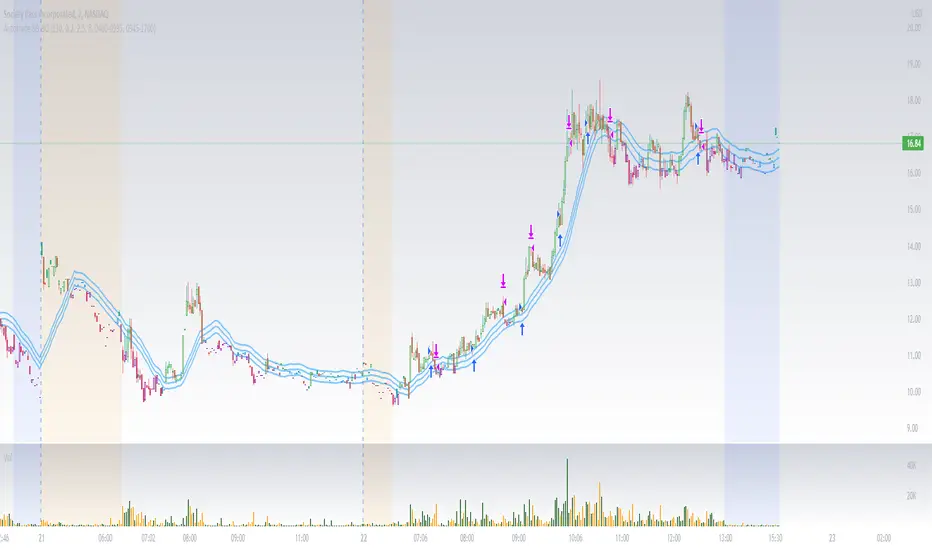
Super Auto Breakout Day Trade Volatile stocksThis strategy is looking at MA and distance from MA to determine entry and exit for highly volatile day trade stocks. This trading strategy is not good for big-cap stocks as the movement there is not much in terms of %. The target for open trade is to close at a 10% gain or at 2.8% loss which is a good risk to reward ratio. אסטרטגיית Pine Script®מאת beststockalertמעודכן 1212548
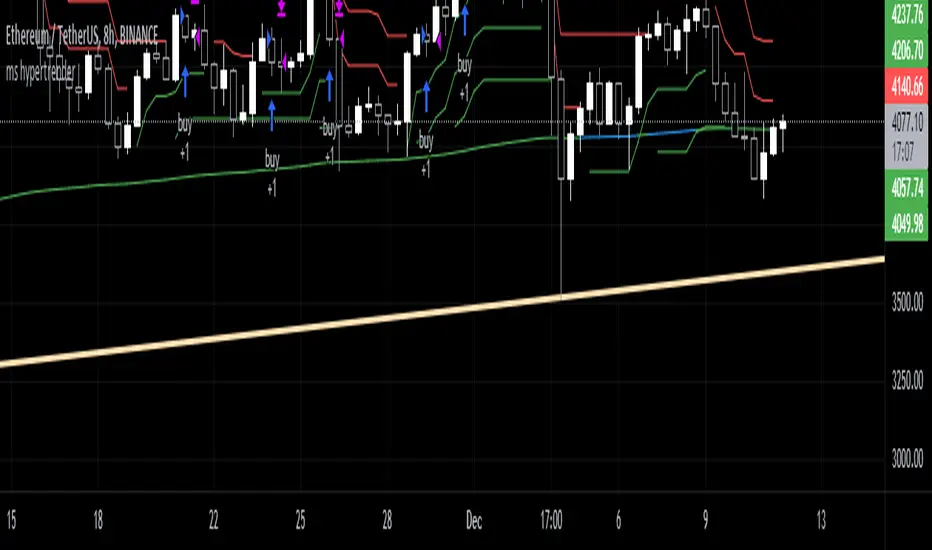
ms hypersupertrendThis is a well-known strategy by using 3 different Supertrends and a trend-defining EMA, feel free to play around with the settings, a backtest on 8h ETHUSDT pair brought some good results using the 233EMA and investing 75% of a 10k start capital the idea is to have at least 2 super trends going green above the trend-EMA to go long and exit by turning 2 super trends red (idea: 1 super trend in red could initialize a take profit) shorts work vice versa The EMA shows in green for uptrends and in red for downtrends, if it is blue no Signal will be taken because the 3 super trends are not all above or below the trendline(EMA) //------------------------------------------------------------------------------------------------------------------------------------------------- Update 1: - Fixed a minor input error - Added ATR stoploss, and commented out the percentage stop loss - Added time window to backtest - Added exit on risk/reward is met - This version is only buy...wait for next update adding shorts and more As always, thanks for your ideas, likes, and support. Feel free to mess around with the settings and give me your feedback.אסטרטגיית Pine Script®מאת theasgard66367
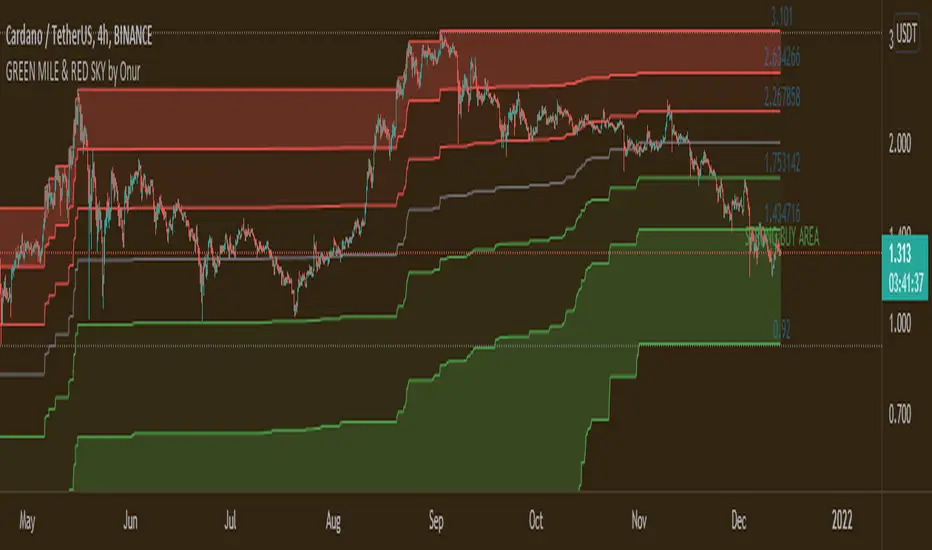
GREEN MILE & RED SKY by OnurThis indicator is the upgrated version of "GREEN MILE by Onur". Indicator shows fibonacci buying + selling levels due to the past 3500 (adjustable and 1500 by default) candles. Prices in the dark green area is a strong buying signal. Prices in the dark red areas is strong selling signal Decreasing period value makes indicator effective from long term to short term. Works harmoniously with MACD & RSI indicators. אינדיקטור Pine Script®מאת SenatorVonShaft55242
moonshot hypertrender (supertrend strategy) This is a well-known strategy by using 3 different Supertrends and a trend-defining EMA, feel free to play around with the settings, a backtest on 8h ETHUSDT pair brought some good results using the 233EMA and investing 75% of a 10k start capital. The idea is to have at least 2 Supertrends going green above the trend-EMA to go into a long position. The exit will be triggered if 2 Supertrends change to red (idea: 1 super trend in red could initialize a take profit). Taking shorts works vice versa. The EMA shows in green for uptrends and in red for downtrends, if it is blue (ranging market) no Signal will be taken because the 3 Supertrends are not all above or below the trendline(EMA). I heard about this strategy on youtube but I can't get the promised 60% win-rate ;) any suggestions to improve it are welcome Hope you find it useful and it would be nice to get your feedback -theasgard- אסטרטגיית Pine Script®מאת theasgard1158
Supertrend - Ladder ATRThis is a supertrend with slight twisted concept which can be very benefecial in strong trending markets to reduce stop loss distance and exit slightly quicker. ⬜ Concept ▶ When the instrument is trending up, regular ATR shows high values if there are big green candles. This affect the stoploss distance in regular supertrend which leads to wide stops or delayed lagging. When you are in long trade, what matters for stoploss is how much a negative candle can move within bar. Hence, using ATR derived only based on red candles is more beneficial for trailing stops on long signals. Same applies to short trades where using ATR derived from only green candles is more efficient than overall ATR. ▶ ATR will be minimal when the volatility is less and ATR will increase with volatility. That means, once you are in trade, the trailing of stoploss also will vary based on ATR (or volatility). With regular ATR and supertrend, chances of stop loss distance widening is high with increased volatility even though stoploss levels will not move down. This again poses the risk of higher drawdown during trade closure and also keeps in the trade during ranging market. To avoid this, the second trick we are using here is only to reduce the atr stoploss difference when in trade. That is, when in long trade and negative candles ATR is increasing, we will not consider that. We will consider the new ATR only if it is lesser than previous bar ATR. Effect of these changes on the trending market is quite visual. Lets take example of USDTRY Settings are quite simple and does not vary much from regular supertrend settings. אינדיקטור Pine Script®מאת Trendoscopeמעודכן 6060 6 K
Double SupertrendThis strategy is based on a custom indicator that was created based on the Supertrend indicator. At its core, there are always 2 super trend indicators with different factors to reduce market noise (false signals). The strategy/indicator has some parameters to improve the signals and filters. TECHNICAL ANALYSIS ☑ Show Indicators This option will enable/disable the Supertrend indicators on the chart. ☑ Length The length will be used on the Supertrend Indicator to calculate its values. ☑ Dev Fast The fast deviation or factor from one of the super trend indicators. This will be the leading indicator for entry signals, as well as for the exit signals. ☑ Dev Slow The slow deviation or factor from one of the super trend indicators. This will be the confirmation indicator for entry and exit signals. ☑ Exit Type It's possible to select from 4 options for the exit signals. Exit signals always take profit target. ☑ ⥹ Reversals This option will make the strategy/indicator calculate the exit signals based on the difference between the given period's highest and lowest candle value (see Period on this list). It's displayed on the chart with the cross. As it's possible to verify in the image below, there are multiple exit spots for every entry. ☑ ⥹ ATR Using ATR as a base indicator for exit signals will make the strategy/indicator place limit/stop orders. Candle High + ATR for longs, Candle Low - ATR for shorts. The strategy will show the ATR level for take profit and stick with it until the next signal. This way, the take profit value remains based on the candle of the entry signal. ☑ ⥹ Fast Supertrend With this option selected, the exit signals will be based on the Fast Supertsignal value, mirrored to make a profit. ☑ ⥹ Slow Supertrend With this option selected, the exit signals will be based on the Slow Supertsignal value, which is mirrored to take profit. ☑ Period This will represent the number of candles used on the exit signals when Reversals is selected as Exit Type. It's also used to calculate the gradient used on the Fills and Supertrend signals. ☑ Multiplier It's used on the take profit when the ATR option is selected on the Exit Type. STRATEGY ☑ Use The Strategy This will enable/disable the strategy to show the trades calculations. ☑ Show Use Long/Short Entries Option to make the strategy show/use Long or Short signals. Available only if Use The Strategy is enabled ☑ Show Use Exit Long/Short Option to make the strategy show/use Exit Long or Short signals (valid when Reversals option is selected on the Exit Type). Available only if Use The Strategy is enabled ☑ Show Use Add Long/Short Option to make the strategy show/use Add Long or Short signals. With this option enabled, the strategy will place multiple trades in the same direction, almost the same concept as a pyramiding parameter. It's based on the Fast Supersignal when the candle fails to cross and reverses. Available only if Use The Strategy is enabled ☑ Trades Date Start/End The date range that the strategy will check the market data and make the trades HOW TO USE It's very straightforward. A long signal will appear as a green arrow with a text Long below it. A short signal will appear as a red arrow with a text Short above it. It's ideal to wait for the candle to finish to validate the signal. The exit signals are optional but give a good idea of the configuration used when backtesting. Each market and timeframe will have its own configuration for the best results. On average, sticking to ATR as an exit signal will have less risk than the other options. ☑ Entry Signals Follow the arrows with Long/Short texts on them. Wait for the signal candle to close to validate the entry. ☑ Exit Signals Use them to close your position or to trail stop your orders and maximize profits. Select the exit type suitable for each timeframe and market ☑ Add Entries It's possible to increase the position following the add margin/contracts based on the Add signals. Not mandatory, but may work as reentries or late entries using the same signal. ☑ What about Stop Loss? The stop-loss levels were not included as a separated signal because it's already in the chart. There are some possible ideas for the stop loss: ☑⥹ Candle High/Low (2nd recommend option) When it's a Long signal from the entry signal candle, the stop loss can be the Low value of the same candle. Very tight stop loss in some cases, depending on the candle range ☑⥹ Local Top/Bottom Selecting the local top/bottom as stop loss will give the strategy more room for false breakouts or reversals, keeping the trade open and minimizing noises. Increases the risk ☑⥹ Fast Supertrend (1st recommend option) The fast supertrend can be used as stop-loss as well. making it a moving level and working close to trail stop management ☑⥹ Fixed Percentage It's possible to use a fixed risk percentage for the trades, making the risk easier to control and project. Since the market volatility is not fixed, this may affect the accuracy of the trades ☑⥹ Based on the ATR (3rd recommend option) When the exit type option ATR is selected, it will display the take profit level for that entry. Just mirror that value and put it as stop-loss, or multiply that amount by 1.5 to have more room for market noise. EXAMPLE CONFIGURATIONS Here are some configuration ideas for some markets (all of them are from crypto, especially futures markets) BTCUSDT 15min - Default configuration BTCUSDT 1h - Length 10 | Dev Fast 3 | Dev Slow 4 | Exit Type ATR | Period 50 | Multiplier 1 BTCUSDT 4h - Length 10 | Dev Fast 2 | Dev Slow 4 | Exit Type ATR | Period 50 | Multiplier 1 ETHUSDT 15min - Length 20 | Dev Fast 1 | Dev Slow 3 | Exit Type Fast Supertrend | Period 50 | Multiplier 1 IOTAUSDT 15min - Length 10 | Dev Fast 1 | Dev Slow 2 | Exit Type Slow Supertrend | Period 50 | Multiplier 1 OMGUSDT 15min - Length 10 | Dev Fast 1 | Dev Slow 4 | Exit Type Slow Supertrend | Period 50 | Multiplier 1 VETUSDT 15min - Length 10 | Dev Fast 3 | Dev Slow 4 | Exit Type Slow Supertrend | Period 50 | Multiplier 1 HOW TO FIND OTHER CONFIGURATIONS Here are some steps to find suitable configurations select a market and time frame enable the Use This Strategy option on the strategy open the strategy tester panel and select the performance summary open the strategy configuration and go to properties change the balance to the same price of the symbol (example: BTCUSDT 60.000, use 60.000 as balance) go back to the inputs tab and keep changing the parameters until you see the net profit be positive and bigger than the absolute value of the drawdown in case you can't find a suitable configuration, try other timeframes Since the tester reflects what happened in the past candles, it's not guaranteed to give the same results. However, this indicator/Strategy can be used with other indicators as a leading signal or confirmation signal. אסטרטגיית Pine Script®מאת ThiagoSchmitzמעודכן 66911
Close to SupertrendMany a times, we have seen that the price closing in towards supertrend reverses. This indicator gives signal that identifies high / low of any candle if near the down / up supertrend line by a defined margin using arrow signals. I've simply re-used readily available supertrend indicator source code and just modified it to these signals. So, almost all of the source code is not mine. Enter the short / long position when arrow signal appears. SL / trend reversal will be mandatorily at close of a candle above or below the supertrend line, and the supertrend changes direction. Hope this indicator comes handy for you.אינדיקטור Pine Script®מאת SushilKothawade33492
Supertrend + RSI Strategy [Alose]This strategy combines the best of both indicators (Supertrend & RSI). As we know, Supertrend is excellent at finding changes in the market trend and thus finding the best entries, however in my opinion it has a great weakness and it is that it does not know how to find the best exit point. For this reason I decided to combine it with the RSI that we know usually knows the highest and lowest rebound points of the price, thus managing to find the best exit point for the strategy. The best thing about combining these 2 indicators is that our trades will obtain better profits in less time. LONG ENTRY When SuperTrend changes its direction and it is less than 0. LONG EXIT There are two ways to close the trade: When RSI is overbought, you can choose the "Overbought Level " inside the strategy settings (Default: 72). When SuperTrend changes its direction and it is grater than 0. SHORT ENTRY (You can enable short entries in strategy settings) When SuperTrend changes its direction and it is grater than 0. LONG EXIT There are two ways to close the trade: When RSI is oversold, you can choose the "Oversold Level " inside the strategy settings (Default: 28). When SuperTrend changes its direction and it is less than 0. אסטרטגיית Pine Script®מאת alorse33588