utilsLibrary "utils"
Provides a set of utility functions for use in strategies or indicators.
colorGreen(opacity)
Parameters:
opacity (int)
colorRed(opacity)
Parameters:
opacity (int)
colorTeal(opacity)
Parameters:
opacity (int)
colorBlue(opacity)
Parameters:
opacity (int)
colorOrange(opacity)
Parameters:
opacity (int)
colorPurple(opacity)
Parameters:
opacity (int)
colorPink(opacity)
Parameters:
opacity (int)
colorYellow(opacity)
Parameters:
opacity (int)
colorWhite(opacity)
Parameters:
opacity (int)
colorBlack(opacity)
Parameters:
opacity (int)
trendChangingUp(emaShort, emaLong)
Signals when the trend is starting to change in a positive direction.
Parameters:
emaShort (float)
emaLong (float)
Returns: bool
trendChangingDown(emaShort, emaLong)
Signals when the trend is starting to change in a negative direction.
Parameters:
emaShort (float)
emaLong (float)
Returns: bool
percentChange(start, end)
Returns the percent change between a start number and end number. A positive change returns a positive value and vice versa.
Parameters:
start (float)
end (float)
Returns: float
percentOf(percent, n)
Returns the number that's the percentage of the provided value.
Parameters:
percent (float) : Use 0.2 for 20 percent, 0.35 for 35 percent, etc.
n (float) : The number to calculate the percentage of.
Returns: float
targetPriceByPercent(percent, n)
Parameters:
percent (float)
n (float)
hasNegativeSlope(start, end)
Parameters:
start (float)
end (float)
timeinrange(resolution, session, timezone)
Returns true when the current time is within a given session window. Note, the time is calculated in the "America/New_York" timezone.
Parameters:
resolution (simple string) : The time interval to use to start/end the background color. Use "1" for the coloring the background up to the minute.
session (simple string) : The session string to use to identify the time window. Example: "0930-1600:23456" means normal market hours on weekdays.
timezone (simple string)
Returns: series bool
barsSinceLastEntry()
Returns the number of bars since the last entry order.
Returns: series int
barsSinceLastExit()
Returns the number of bars since the last exit order.
Returns: series int
calcSlope(ln, lookback)
Calculates the slope of the provided line based on its x,y coordinates in the previous bar to the current bar.
Parameters:
ln (float)
lookback (int)
Returns: series float
openPL()
Returns slope of the line given the start and end x,y coordinates.
Returns: series float
hasConsecutiveNegativeCandles(lookbackInput)
Returns true if the number of consecutive red candles matches the provided count.
Parameters:
lookbackInput (int) : The amount of bars to look back to check for consecutive negative bars. Default = 1.
Returns: series bool
stdevPercent(stdev, price)
Returns the standard deviation as a percentage of price.
Parameters:
stdev (float) : The standard deviation value
price (float) : The current price of the target ticker.
Returns: series float
Timesessions
HT: Functions LibLibrary "Functions"
is_date_equal(date1, date2, time_zone)
Parameters:
date1 (int)
date2 (int)
time_zone (string)
is_date_equal(date1, date2_str, time_zone)
Parameters:
date1 (int)
date2_str (string)
time_zone (string)
is_date_between(date_, start_year, start_month, end_year, end_month, time_zone_)
Parameters:
date_ (int)
start_year (int)
start_month (int)
end_year (int)
end_month (int)
time_zone_ (string)
is_time_equal(time1, time2_str, time_zone)
Parameters:
time1 (int)
time2_str (string)
time_zone (string)
is_time_equal(time1, time2, time_zone)
Parameters:
time1 (int)
time2 (int)
time_zone (string)
is_time_between(time_, start_hour, start_minute, end_hour, end_minute, time_zone_)
Parameters:
time_ (int)
start_hour (int)
start_minute (int)
end_hour (int)
end_minute (int)
time_zone_ (string)
is_time_between(time_, start_time, end_time, time_zone_)
Parameters:
time_ (int)
start_time (string)
end_time (string)
time_zone_ (string)
is_close(value, level, ticks)
Parameters:
value (float)
level (float)
ticks (int)
is_inrange(value, lb, hb)
Parameters:
value (float)
lb (float)
hb (float)
is_above(value, level, ticks)
Parameters:
value (float)
level (float)
ticks (int)
is_below(value, level, ticks)
Parameters:
value (float)
level (float)
ticks (int)

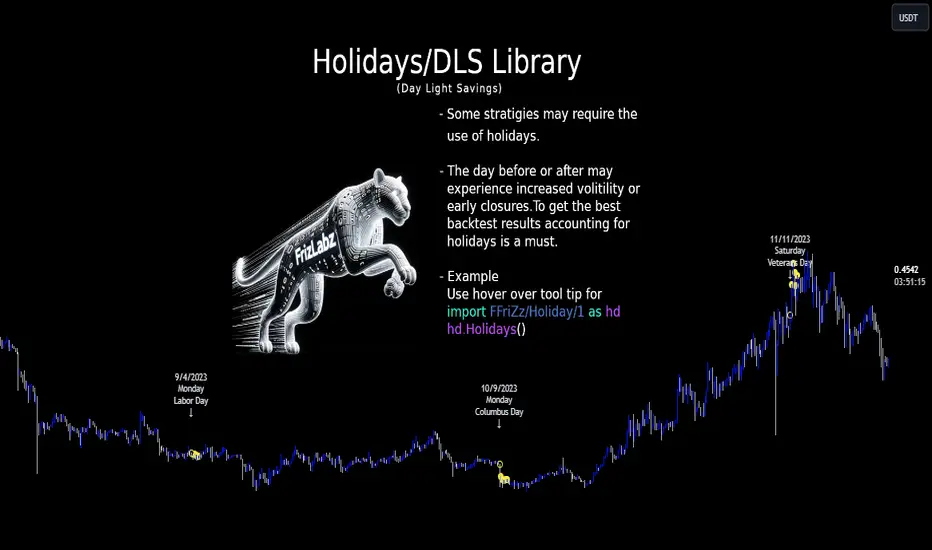
HolidayLibrary "Holiday"
- Full Control over Holidays and Daylight Savings Time (DLS)
The Holiday Library is an essential tool for traders and analysts who engage in backtesting and live trading . This comprehensive library enables the incorporation of crucial calendar elements - specifically Daylight Savings Time (DLS) adjustments and public holidays - into trading strategies and backtesting environments.
Key Features:
- DLS Adjustments: The library takes into account the shifts in time due to Daylight Savings. This feature is particularly vital for backtesting strategies, as DLS can impact trading hours, which in turn affects the volatility and liquidity in the market. Accurate DLS adjustments ensure that backtesting scenarios are as close to real-life conditions as possible.
- Comprehensive Holiday Metadata: The library includes a rich set of holiday metadata, allowing for the detailed scheduling of trading activities around public holidays. This feature is crucial for avoiding skewed results in backtesting, where holiday trading sessions might differ significantly in terms of volume and price movement.
- Customizable Holiday Schedules: Users can add or remove specific holidays, tailoring the library to fit various regional market schedules or specific trading requirements.
- Visualization Aids: The library supports on-chart labels, making it visually intuitive to identify holidays and DLS shifts directly on trading charts.
Use Cases:
1. Strategy Development: When developing trading strategies, it’s important to account for non-trading days and altered trading hours due to holidays and DLS. This library enables a realistic and accurate representation of these factors.
2. Risk Management: Trading around holidays can be riskier due to thinner liquidity and greater volatility. By integrating holiday data, traders can better manage their risk exposure.
3. Backtesting Accuracy: For backtesting to be effective, it must simulate the actual market conditions as closely as possible. Incorporating holidays and DLS adjustments contributes to more reliable and realistic backtesting results.
4. Global Trading: For traders active in multiple global markets, this library provides an easy way to handle different holiday schedules and DLS shifts across regions.
The Holiday Library is a versatile tool that enhances the precision and realism of trading simulations and strategy development . Its integration into the trading workflow is straightforward and beneficial for both novice and experienced traders.
EasterAlgo(_year)
Calculates the date of Easter Sunday for a given year using the Anonymous Gregorian algorithm.
`Gauss Algorithm for Easter Sunday` was developed by the mathematician Carl Friedrich Gauss
This algorithm is based on the cycles of the moon and the fact that Easter always falls on the first Sunday after the first ecclesiastical full moon that occurs on or after March 21.
While it's not considered to be 100% accurate due to rare exceptions, it does give the correct date in most cases.
It's important to note that Gauss's formula has been found to be inaccurate for some 21st-century years in the Gregorian calendar. Specifically, the next suggested failure years are 2038, 2051.
This function can be used for Good Friday (Friday before Easter), Easter Sunday, and Easter Monday (following Monday).
en.wikipedia.org
Parameters:
_year (int) : `int` - The year for which to calculate the date of Easter Sunday. This should be a four-digit year (YYYY).
Returns: tuple - The month (1-12) and day (1-31) of Easter Sunday for the given year.
easterInit()
Inits the date of Easter Sunday and Good Friday for a given year.
Returns: tuple - The month (1-12) and day (1-31) of Easter Sunday and Good Friday for the given year.
isLeapYear(_year)
Determine if a year is a leap year.
Parameters:
_year (int) : `int` - 4 digit year to check => YYYY
Returns: `bool` - true if input year is a leap year
method timezoneHelper(utc)
Helper function to convert UTC time.
Namespace types: series int, simple int, input int, const int
Parameters:
utc (int) : `int` - UTC time shift in hours.
Returns: `string`- UTC time string with shift applied.
weekofmonth()
Function to find the week of the month of a given Unix Time.
Returns: number - The week of the month of the specified UTC time.
dayLightSavingsAdjustedUTC(utc, adjustForDLS)
dayLightSavingsAdjustedUTC
Parameters:
utc (int) : `int` - The normal UTC timestamp to be used for reference.
adjustForDLS (bool) : `bool` - Flag indicating whether to adjust for daylight savings time (DLS).
Returns: `int` - The adjusted UTC timestamp for the given normal UTC timestamp.
getDayOfYear(monthOfYear, dayOfMonth, weekOfMonth, dayOfWeek, lastOccurrenceInMonth, holiday)
Function gets the day of the year of a given holiday (1-366)
Parameters:
monthOfYear (int)
dayOfMonth (int)
weekOfMonth (int)
dayOfWeek (int)
lastOccurrenceInMonth (bool)
holiday (string)
Returns: `int` - The day of the year of the holiday 1-366.
method buildMap(holidayMap, holiday, monthOfYear, weekOfMonth, dayOfWeek, dayOfMonth, lastOccurrenceInMonth, closingTime)
Function to build the `holidaysMap`.
Namespace types: map
Parameters:
holidayMap (map) : `map` - The map of holidays.
holiday (string) : `string` - The name of the holiday.
monthOfYear (int) : `int` - The month of the year of the holiday.
weekOfMonth (int) : `int` - The week of the month of the holiday.
dayOfWeek (int) : `int` - The day of the week of the holiday.
dayOfMonth (int) : `int` - The day of the month of the holiday.
lastOccurrenceInMonth (bool) : `bool` - Flag indicating whether the holiday is the last occurrence of the day in the month.
closingTime (int) : `int` - The closing time of the holiday.
Returns: `map` - The updated map of holidays
holidayInit(addHolidaysArray, removeHolidaysArray, defaultHolidays)
Initializes a HolidayStorage object with predefined US holidays.
Parameters:
addHolidaysArray (array) : `array` - The array of additional holidays to be added.
removeHolidaysArray (array) : `array` - The array of holidays to be removed.
defaultHolidays (bool) : `bool` - Flag indicating whether to include the default holidays.
Returns: `map` - The map of holidays.
Holidays(utc, addHolidaysArray, removeHolidaysArray, adjustForDLS, displayLabel, defaultHolidays)
Main function to build the holidays object, this is the only function from this library that should be needed. \
all functionality should be available through this function. \
With the exception of initializing a `HolidayMetaData` object to add a holiday or early close. \
\
**Default Holidays:** \
`DLS begin`, `DLS end`, `New Year's Day`, `MLK Jr. Day`, \
`Washington Day`, `Memorial Day`, `Independence Day`, `Labor Day`, \
`Columbus Day`, `Veterans Day`, `Thanksgiving Day`, `Christmas Day` \
\
**Example**
```
HolidayMetaData valentinesDay = HolidayMetaData.new(holiday="Valentine's Day", monthOfYear=2, dayOfMonth=14)
HolidayMetaData stPatricksDay = HolidayMetaData.new(holiday="St. Patrick's Day", monthOfYear=3, dayOfMonth=17)
HolidayMetaData addHolidaysArray = array.from(valentinesDay, stPatricksDay)
string removeHolidaysArray = array.from("DLS begin", "DLS end")
܂Holidays = Holidays(
܂ utc=-6,
܂ addHolidaysArray=addHolidaysArray,
܂ removeHolidaysArray=removeHolidaysArray,
܂ adjustForDLS=true,
܂ displayLabel=true,
܂ defaultHolidays=true,
܂ )
plot(Holidays.newHoliday ? open : na, title="newHoliday", color=color.red, linewidth=4, style=plot.style_circles)
```
Parameters:
utc (int) : `int` - The UTC time shift in hours
addHolidaysArray (array) : `array` - The array of additional holidays to be added
removeHolidaysArray (array) : `array` - The array of holidays to be removed
adjustForDLS (bool) : `bool` - Flag indicating whether to adjust for daylight savings time (DLS)
displayLabel (bool) : `bool` - Flag indicating whether to display a label on the chart
defaultHolidays (bool) : `bool` - Flag indicating whether to include the default holidays
Returns: `HolidayObject` - The holidays object | Holidays = (holidaysMap: map, newHoliday: bool, holiday: string, dayString: string)
HolidayMetaData
HolidayMetaData
Fields:
holiday (series string) : `string` - The name of the holiday.
dayOfYear (series int) : `int` - The day of the year of the holiday.
monthOfYear (series int) : `int` - The month of the year of the holiday.
dayOfMonth (series int) : `int` - The day of the month of the holiday.
weekOfMonth (series int) : `int` - The week of the month of the holiday.
dayOfWeek (series int) : `int` - The day of the week of the holiday.
lastOccurrenceInMonth (series bool)
closingTime (series int) : `int` - The closing time of the holiday.
utc (series int) : `int` - The UTC time shift in hours.
HolidayObject
HolidayObject
Fields:
holidaysMap (map) : `map` - The map of holidays.
newHoliday (series bool) : `bool` - Flag indicating whether today is a new holiday.
activeHoliday (series bool) : `bool` - Flag indicating whether today is an active holiday.
holiday (series string) : `string` - The name of the holiday.
dayString (series string) : `string` - The day of the week of the holiday.
ForecastingThis Forecasting library has a couple of Novel and traditional approaches to forecasting stock prices.
Traditionally, it provides a basic ARIMA forecaster using simple autoregression, as well as a linear regression and quadratic regression channel forecaster.
Novel approaches to forecasting include:
1) A Moving Average based Forecaster (modelled after ARIMA), it is capable of forecasting based on a user selected SMA.
2) Z-Score Forecast: Forecasting based on Z-Score (example displayed in chart).
Library "Forecasting"
ARIMA_Modeller(src)
: Creates a generic autoregressive ARIMA model
Parameters:
src (float)
Returns: : arima_result, arima_ucl, arima_lcl, arima_cor, arima_r2, arima_err, y1, y2, y3, y0
machine_learning_regression(output, x1, x2, x3, x4, x5, show_statistics)
: Creates an automatic regression based forecast model (can be used for other regression operations) from a list of possible independent variables.
Parameters:
output (float)
x1 (float)
x2 (float)
x3 (float)
x4 (float)
x5 (float)
show_statistics (bool)
Returns: : result, upper bound levels, lower bound levels, optional statitics table that displays the model parameters and statistics
time_series_linear_forecast(src, forecast_length, standard_deviation_extension_1, standard_deviation_extension_2)
: Creates a simple linear regression time series channel
Parameters:
src (float)
forecast_length (int)
standard_deviation_extension_1 (float)
standard_deviation_extension_2 (float)
Returns: : Linreg Channel
quadratic_time_series_forecast(src, forecast_length)
: Creates a simple quadratic regression time series channel
Parameters:
src (float)
forecast_length (int)
Returns: : Quadratic Regression Channel
moving_average_forecaster(source, train_time, ma_length, forecast_length, forecast_result, upper_bound_result, lower_bound_result)
: Creates an ARIMA style moving average forecaster
Parameters:
source (float)
train_time (int)
ma_length (int)
forecast_length (int)
forecast_result (float )
upper_bound_result (float )
lower_bound_result (float )
Returns: : forecast_result, upper_bound_result, lower_bound_result, moving_average, ucl, lcl
zscore_forecast(z_length, z_source, show_alerts, forecast_length, show_forecast_table)
: Creates a Z-Score Forecast and is capable of plotting the immediate forecast via a Polyline
Parameters:
z_length (int)
z_source (float)
show_alerts (bool)
forecast_length (int)
show_forecast_table (bool)
Returns: : The export is void, it will export the Polyline forecast and the Z-forecast table if you enable it.

chrono_utilsLibrary "chrono_utils"
Collection of objects and common functions that are related to datetime windows session days and time
ranges. The main purpose of this library is to handle time-related functionality and make it easy to reason about a
future bar and see if it is part of a predefined user session and/or inside a datetime window. All existing session
functions I found in the documentation e.g. "not na(time(timeframe, session, timezone))" are not suitable for
strategies, since the execution of the orders is delayed by one bar due to the execution happening at the bar close.
So a prediction for the next bar is necessary. Moreover, a history operator with a negative value is not allowed e.g.
`not na(time(timeframe, session, timezone) )` expression is not valid. Thus, I created this library to overcome
this small but very important limitation. In the meantime, I added useful functionality to handle session-based
behavior. An interesting utility that emerged from this development is data anomaly detection where a comparison
between the prediction and the actual value is happening. If those two values are different then a data inconsistency
happens between the prediction bar and the actual bar (probably due to a holiday or half session day etc..)
exTimezone(timezone)
exTimezone - Convert extended timezone to timezone string
Parameters:
timezone (simple string) : - The timezone or a special string
Returns: string representing the timezone
nameOfDay(day)
nameOfDay - Convert the day id into a short nameOfDay
Parameters:
day (int) : - The day id to convert
Returns: - The short name of the day
today()
today - Get the day id of this day
Returns: - The day id
nthDayAfter(day, n)
nthDayAfter - Get the day id of n days after the given day
Parameters:
day (int) : - The day id of the reference day
n (int) : - The number of days to go forward
Returns: - The day id of the day that is n days after the reference day
nextDayAfter(day)
nextDayAfter - Get the day id of next day after the given day
Parameters:
day (int) : - The day id of the reference day
Returns: - The day id of the next day after the reference day
nthDayBefore(day, n)
nthDayBefore - Get the day id of n days before the given day
Parameters:
day (int) : - The day id of the reference day
n (int) : - The number of days to go forward
Returns: - The day id of the day that is n days before the reference day
prevDayBefore(day)
prevDayBefore - Get the day id of previous day before the given day
Parameters:
day (int) : - The day id of the reference day
Returns: - The day id of the previous day before the reference day
tomorrow()
tomorrow - Get the day id of the next day
Returns: - The next day day id
normalize(num, min, max)
normalizeHour - Check if number is inthe range of
Parameters:
num (int)
min (int)
max (int)
Returns: - The normalized number
normalizeHour(hourInDay)
normalizeHour - Check if hour is valid and return a noralized hour range from
Parameters:
hourInDay (int)
Returns: - The normalized hour
normalizeMinute(minuteInHour)
normalizeMinute - Check if minute is valid and return a noralized minute from
Parameters:
minuteInHour (int)
Returns: - The normalized minute
monthInMilliseconds(mon)
monthInMilliseconds - Calculate the miliseconds in one bar of the timeframe
Parameters:
mon (int) : - The month of reference to get the miliseconds
Returns: - The number of milliseconds of the month
barInMilliseconds()
barInMilliseconds - Calculate the miliseconds in one bar of the timeframe
Returns: - The number of milliseconds in one bar
method init(this, fromDateTime, toDateTime)
init - Initialize the time window object from boolean values of each session day
Namespace types: DateTimeWindow
Parameters:
this (DateTimeWindow) : - The time window object that will hold the from and to datetimes
fromDateTime (int) : - The starting datetime of the time window
toDateTime (int) : - The ending datetime of the time window
Returns: - The time window object
method init(this, refTimezone, chTimezone, fromDateTime, toDateTime)
init - Initialize the time window object from boolean values of each session day
Namespace types: DateTimeWindow
Parameters:
this (DateTimeWindow) : - The time window object that will hold the from and to datetimes
refTimezone (simple string) : - The timezone of reference of the 'from' and 'to' dates
chTimezone (simple string) : - The target timezone to convert the 'from' and 'to' dates
fromDateTime (int) : - The starting datetime of the time window
toDateTime (int) : - The ending datetime of the time window
Returns: - The time window object
method init(this, sun, mon, tue, wed, thu, fri, sat)
init - Initialize the session days object from boolean values of each session day
Namespace types: SessionDays
Parameters:
this (SessionDays) : - The session days object that will hold the day selection
sun (bool) : - Is Sunday a trading day?
mon (bool) : - Is Monday a trading day?
tue (bool) : - Is Tuesday a trading day?
wed (bool) : - Is Wednesday a trading day?
thu (bool) : - Is Thursday a trading day?
fri (bool) : - Is Friday a trading day?
sat (bool) : - Is Saturday a trading day?
Returns: - The session days objectfrom_chart
method init(this, unixTime)
init - Initialize the object from the hour and minute of the session time in exchange timezone (syminfo.timezone)
Namespace types: SessionTime
Parameters:
this (SessionTime) : - The session time object with the hour and minute of the time of the day
unixTime (int) : - The unix time
Returns: - The session time object
method init(this, hourInDay, minuteInHour)
init - Initialize the object from the hour and minute of the session time in exchange timezone (syminfo.timezone)
Namespace types: SessionTime
Parameters:
this (SessionTime) : - The session time object with the hour and minute of the time of the day
hourInDay (int) : - The hour of the time
minuteInHour (int) : - The minute of the time
Returns: - The session time object
method init(this, hourInDay, minuteInHour, refTimezone)
init - Initialize the object from the hour and minute of the session time
Namespace types: SessionTime
Parameters:
this (SessionTime) : - The session time object with the hour and minute of the time of the day
hourInDay (int) : - The hour of the time
minuteInHour (int) : - The minute of the time
refTimezone (string) : - The timezone of reference of the 'hour' and 'minute'
Returns: - The session time object
method init(this, startTime, endTime)
init - Initialize the object from the start and end session time in exchange timezone (syminfo.timezone)
Namespace types: SessionTimeRange
Parameters:
this (SessionTimeRange) : - The session time range object that will hold the start and end time of the daily session
startTime (SessionTime) : - The time the session begins
endTime (SessionTime) : - The time the session ends
Returns: - The session time range object
method init(this, startTimeHour, startTimeMinute, endTimeHour, endTimeMinute, refTimezone)
init - Initialize the object from the start and end session time
Namespace types: SessionTimeRange
Parameters:
this (SessionTimeRange) : - The session time range object that will hold the start and end time of the daily session
startTimeHour (int) : - The time hour the session begins
startTimeMinute (int) : - The time minute the session begins
endTimeHour (int) : - The time hour the session ends
endTimeMinute (int) : - The time minute the session ends
refTimezone (string)
Returns: - The session time range object
method init(this, days, timeRanges)
init - Initialize the user session object from session days and time range
Namespace types: UserSession
Parameters:
this (UserSession) : - The user-defined session object that will hold the day and the time range selection
days (SessionDays) : - The session days object that defines the days the session is happening
timeRanges (SessionTimeRange ) : - The array of all the session time ranges during a session day
Returns: - The user session object
method to_string(this)
to_string - Formats the time window into a human-readable string
Namespace types: DateTimeWindow
Parameters:
this (DateTimeWindow) : - The time window object with the from and to datetimes
Returns: - The string of the time window
method to_string(this)
to_string - Formats the session days into a human-readable string with short day names
Namespace types: SessionDays
Parameters:
this (SessionDays) : - The session days object with the day selection
Returns: - The string of the session day short names
method to_string(this)
to_string - Formats the session time into a human-readable string
Namespace types: SessionTime
Parameters:
this (SessionTime) : - The session time object with the hour and minute of the time of the day
Returns: - The string of the session time
method to_string(this)
to_string - Formats the session time into a human-readable string
Namespace types: SessionTimeRange
Parameters:
this (SessionTimeRange) : - The session time range object with the start and end time of the daily session
Returns: - The string of the session time
method to_string(this)
to_string - Formats the user session into a human-readable string
Namespace types: UserSession
Parameters:
this (UserSession) : - The user-defined session object with the day and the time range selection
Returns: - The string of the user session
method to_string(this)
to_string - Formats the bar into a human-readable string
Namespace types: Bar
Parameters:
this (Bar) : - The bar object with the open and close times
Returns: - The string of the bar times
method to_string(this)
to_string - Formats the chart session into a human-readable string
Namespace types: ChartSession
Parameters:
this (ChartSession) : - The chart session object that contains the days and the time range shown in the chart
Returns: - The string of the chart session
method get_size_in_secs(this)
get_size_in_secs - Count the seconds from start to end in the given timeframe
Namespace types: DateTimeWindow
Parameters:
this (DateTimeWindow) : - The time window object with the from and to datetimes
Returns: - The number of seconds inside the time widow for the given timeframe
method get_size_in_secs(this)
get_size_in_secs - Calculate the seconds inside the session
Namespace types: SessionTimeRange
Parameters:
this (SessionTimeRange) : - The session time range object with the start and end time of the daily session
Returns: - The number of seconds inside the session
method get_size_in_bars(this)
get_size_in_bars - Count the bars from start to end in the given timeframe
Namespace types: DateTimeWindow
Parameters:
this (DateTimeWindow) : - The time window object with the from and to datetimes
Returns: - The number of bars inside the time widow for the given timeframe
method get_size_in_bars(this)
get_size_in_bars - Calculate the bars inside the session
Namespace types: SessionTimeRange
Parameters:
this (SessionTimeRange) : - The session time range object with the start and end time of the daily session
Returns: - The number of bars inside the session for the given timeframe
method from_chart(this)
from_chart - Initialize the session days object from the chart
Namespace types: SessionDays
Parameters:
this (SessionDays) : - The session days object that will hold the day selection
Returns: - The user session object
method from_chart(this)
from_chart - Initialize the session time range object from the chart
Namespace types: SessionTimeRange
Parameters:
this (SessionTimeRange) : - The session time range object that will hold the start and end time of the daily session
Returns: - The session time range object
method from_chart(this)
from_chart - Initialize the session object from the chart
Namespace types: ChartSession
Parameters:
this (ChartSession) : - The chart session object that will hold the days and the time range shown in the chart
Returns: - The chart session object
method to_sess_string(this)
to_sess_string - Formats the session days into a session string with day ids
Namespace types: SessionDays
Parameters:
this (SessionDays) : - The session days object
Returns: - The string of the session day ids
method to_sess_string(this)
to_sess_string - Formats the session time into a session string
Namespace types: SessionTime
Parameters:
this (SessionTime) : - The session time object with the hour and minute of the time of the day
Returns: - The string of the session time
method to_sess_string(this)
to_sess_string - Formats the session time into a session string
Namespace types: SessionTimeRange
Parameters:
this (SessionTimeRange) : - The session time range object with the start and end time of the daily session
Returns: - The string of the session time
method to_sess_string(this)
to_sess_string - Formats the user session into a session string
Namespace types: UserSession
Parameters:
this (UserSession) : - The user-defined session object with the day and the time range selection
Returns: - The string of the user session
method to_sess_string(this)
to_sess_string - Formats the chart session into a session string
Namespace types: ChartSession
Parameters:
this (ChartSession) : - The chart session object that contains the days and the time range shown in the chart
Returns: - The string of the chart session
method from_sess_string(this, sess)
from_sess_string - Initialize the session days object from the session string
Namespace types: SessionDays
Parameters:
this (SessionDays) : - The session days object that will hold the day selection
sess (string) : - The session string part that represents the days
Returns: - The session days object
method from_sess_string(this, sess)
from_sess_string - Initialize the session time object from the session string in exchange timezone (syminfo.timezone)
Namespace types: SessionTime
Parameters:
this (SessionTime) : - The session time object that will hold the hour and minute of the time
sess (string) : - The session string part that represents the time HHmm
Returns: - The session time object
method from_sess_string(this, sess, refTimezone)
from_sess_string - Initialize the session time object from the session string
Namespace types: SessionTime
Parameters:
this (SessionTime) : - The session time object that will hold the hour and minute of the time
sess (string) : - The session string part that represents the time HHmm
refTimezone (simple string) : - The timezone of reference of the 'hour' and 'minute'
Returns: - The session time object
method from_sess_string(this, sess)
from_sess_string - Initialize the session time range object from the session string in exchange timezone (syminfo.timezone)
Namespace types: SessionTimeRange
Parameters:
this (SessionTimeRange) : - The session time range object that will hold the start and end time of the daily session
sess (string) : - The session string part that represents the time range HHmm-HHmm
Returns: - The session time range object
method from_sess_string(this, sess, refTimezone)
from_sess_string - Initialize the session time range object from the session string
Namespace types: SessionTimeRange
Parameters:
this (SessionTimeRange) : - The session time range object that will hold the start and end time of the daily session
sess (string) : - The session string part that represents the time range HHmm-HHmm
refTimezone (simple string) : - The timezone of reference of the time ranges
Returns: - The session time range object
method from_sess_string(this, sess)
from_sess_string - Initialize the user session object from the session string in exchange timezone (syminfo.timezone)
Namespace types: UserSession
Parameters:
this (UserSession) : - The user-defined session object that will hold the day and the time range selection
sess (string) : - The session string that represents the user session HHmm-HHmm,HHmm-HHmm:ddddddd
Returns: - The session time range object
method from_sess_string(this, sess, refTimezone)
from_sess_string - Initialize the user session object from the session string
Namespace types: UserSession
Parameters:
this (UserSession) : - The user-defined session object that will hold the day and the time range selection
sess (string) : - The session string that represents the user session HHmm-HHmm,HHmm-HHmm:ddddddd
refTimezone (simple string) : - The timezone of reference of the time ranges
Returns: - The session time range object
method nth_day_after(this, day, n)
nth_day_after - The nth day after the given day that is a session day (true) in the object
Namespace types: SessionDays
Parameters:
this (SessionDays) : - The session days object with the day selection
day (int) : - The day id of the reference day
n (int) : - The number of days after
Returns: - The day id of the nth session day of the week after the given day
method nth_day_before(this, day, n)
nth_day_before - The nth day before the given day that is a session day (true) in the object
Namespace types: SessionDays
Parameters:
this (SessionDays) : - The session days object with the day selection
day (int) : - The day id of the reference day
n (int) : - The number of days after
Returns: - The day id of the nth session day of the week before the given day
method next_day(this)
next_day - The next day that is a session day (true) in the object
Namespace types: SessionDays
Parameters:
this (SessionDays) : - The session days object with the day selection
Returns: - The day id of the next session day of the week
method previous_day(this)
previous_day - The previous day that is session day (true) in the object
Namespace types: SessionDays
Parameters:
this (SessionDays) : - The session days object with the day selection
Returns: - The day id of the previous session day of the week
method get_sec_in_day(this)
get_sec_in_day - Count the seconds since the start of the day this session time represents
Namespace types: SessionTime
Parameters:
this (SessionTime) : - The session time object with the hour and minute of the time of the day
Returns: - The number of seconds passed from the start of the day until that session time
method get_ms_in_day(this)
get_ms_in_day - Count the milliseconds since the start of the day this session time represents
Namespace types: SessionTime
Parameters:
this (SessionTime) : - The session time object with the hour and minute of the time of the day
Returns: - The number of milliseconds passed from the start of the day until that session time
method eq(this, other)
eq - Compare two bars
Namespace types: Bar
Parameters:
this (Bar) : - The bar object with the open and close times
other (Bar) : - The bar object to compare with
Returns: - Whether this bar is equal to the other one
method get_open_time(this)
get_open_time - The open time object
Namespace types: Bar
Parameters:
this (Bar) : - The bar object with the open and close times
Returns: - The open time object
method get_close_time(this)
get_close_time - The close time object
Namespace types: Bar
Parameters:
this (Bar) : - The bar object with the open and close times
Returns: - The close time object
method get_time_range(this)
get_time_range - Get the time range of the bar
Namespace types: Bar
Parameters:
this (Bar) : - The bar object with the open and close times
Returns: - The time range that the bar is in
getBarNow()
getBarNow - Get the current bar object with time and time_close timestamps
Returns: - The current bar
getFixedBarNow()
getFixedBarNow - Get the current bar with fixed width defined by the timeframe. Note: There are case like SPX 15min timeframe where the last session bar is only 10min. This will return a bar of 15 minutes
Returns: - The current bar
method is_in_window(this, win)
is_in_window - Check if the given bar is between the start and end dates of the window
Namespace types: Bar
Parameters:
this (Bar) : - The bar to check if it is between the from and to datetimes of the window
win (DateTimeWindow) : - The time window object with the from and to datetimes
Returns: - Whether the current bar is inside the datetime window
method is_in_timerange(this, rng)
is_in_timerange - Check if the given bar is inside the session time range
Namespace types: Bar
Parameters:
this (Bar) : - The bar to check if it is between the from and to datetimes
rng (SessionTimeRange) : - The session time range object with the start and end time of the daily session
Returns: - Whether the bar is inside the session time range and if this part of the next trading day
method is_in_days(this, days)
is_in_days - Check if the given bar is inside the session days
Namespace types: Bar
Parameters:
this (Bar) : - The bar to check if its day is a trading day
days (SessionDays) : - The session days object with the day selection
Returns: - Whether the current bar day is inside the session
method is_in_session(this, sess)
is_in_session - Check if the given bar is inside the session as defined by the input params (what "not na(time(timeframe.period, this.to_sess_string()) )" should return if you could write it
Namespace types: Bar
Parameters:
this (Bar) : - The bar to check if it is between the from and to datetimes
sess (UserSession) : - The user-defined session object with the day and the time range selection
Returns: - Whether the current time is inside the session
method next_bar(this, offsetBars)
next_bar - Predicts the next bars open and close time based on the charts session
Namespace types: ChartSession
Parameters:
this (ChartSession) : - The chart session object that contains the days and the time range shown in the chart
offsetBars (simple int) : - The number of bars forward
Returns: - Whether the current time is inside the session
DateTimeWindow
DateTimeWindow - Object that represents a datetime window with a beginning and an end
Fields:
fromDateTime (series int) : - The beginning of the datetime window
toDateTime (series int) : - The end of the datetime window
SessionDays
SessionDays - Object that represent the trading days of the week
Fields:
days (map) : - The map that contains all days of the week and their session flag
SessionTime
SessionTime - Object that represents the time (hour and minutes)
Fields:
hourInDay (series int) : - The hour of the day that ranges from 0 to 24
minuteInHour (series int) : - The minute of the hour that ranges from 0 to 59
minuteInDay (series int) : - The minute of the day that ranges from 0 to 1440. They will be calculated based on hourInDay and minuteInHour when method is called
SessionTimeRange
SessionTimeRange - Object that represents a range that extends from the start to the end time
Fields:
startTime (SessionTime) : - The beginning of the time range
endTime (SessionTime) : - The end of the time range
isOvernight (series bool) : - Whether or not this is an overnight time range
UserSession
UserSession - Object that represents a user-defined session
Fields:
days (SessionDays) : - The map of the user-defined trading days
timeRanges (SessionTimeRange ) : - The array with all time ranges of the user-defined session during the trading days
Bar
Bar - Object that represents the bars' open and close times
Fields:
openUnixTime (series int) : - The open time of the bar
closeUnixTime (series int) : - The close time of the bar
chartDayOfWeek (series int)
ChartSession
ChartSession - Object that represents the default session that is shown in the chart
Fields:
days (SessionDays) : - A map with the trading days shown in the chart
timeRange (SessionTimeRange) : - The time range of the session during a trading day
isFinalized (series bool)

High Risk Trading TimeLibrary "HighRiskTradingTime"
Utilities for time range labeling
openTime()
timeMinInDay(t, timezone)
Convert given time to minutes of day
Parameters:
t (int) : Time
timezone (string) : Timezone of the input h:m
@return Minutes of day
All exported functions args should be typified
timeMinInDayManual(h, m)
Convert given hour and minute to minutes of day
Parameters:
h (int) : Hour in a day
m (int) : Minute in a day
isForexHighRiskTime()
Return if current time is High Risk for Forex

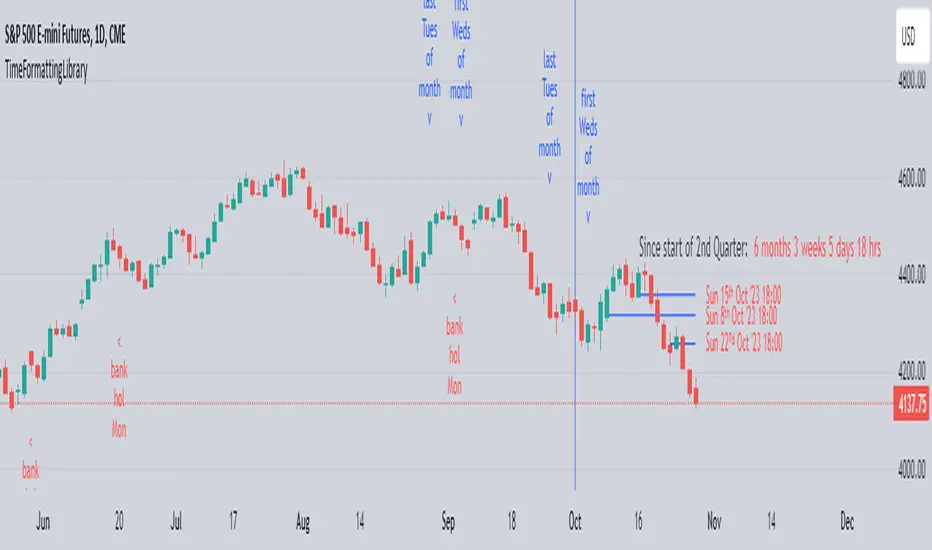
TimeFormattingLibraryLibrary "TimeFormattingLibrary"
Time formatting functions: formating functions to make timestrings more human readable friendly (for both fixed time and time-elapsed).
Also functions for last and first instance in month of day of week input.
Also a function for identifying bank holiday Mondays.
timeFormatFxn(showDayOfWeek, showDayOfMonth, showMonth, showYear, showHrMin, _time, _timezone)
converts time into readable format
Parameters:
showDayOfWeek (bool) : if you want to show day of week (i.e. Mon, Tues etc)
showDayOfMonth (bool) : if you want to show day number of month with superscript ordinals (i.e. 1ˢᵗ, 2ⁿᵈ, etc)
showMonth (bool) : if you want to show the month (i.e. Jan, Feb, etc)
showYear (bool) : if you want to show the year (i.e. 2023)
showHrMin (bool) : if you want to show time in 24hr clock format
_time (int) : is the unix time (i.e. time or time_close)
_timezone (string) : the user timezone input as string (e.g. "America/New_York", "UTC-5", "GMT+0530")
Returns: time date string
timeElapsedFxn(timespan)
converts timespan into readable format
Parameters:
timespan (int) : is the length of time in milliseconds to be converted into a human readable string
Returns: timespan string (whether it be a for showing 'time-elapsed' or for showing a 'countdown timer')
isFirstXdayofmonth(_dayofweek)
gives bool result for when first occurence in month of the day-of-week input
Parameters:
_dayofweek (int) : (can be integer 1-7 or can be dayofweek variable; i.e. dayofweek.wednesday)
isLastXdayofmonth(_dayofweek)
gives bool result for when last occurence in month of the day-of-week input
Parameters:
_dayofweek (int) : (can be integer 1-7 or can be dayofweek variable; i.e. dayofweek.wednesday)
wasBankHolidayMonday()
gives bool result for if yesterday was a bank holiday monday. Only for use with with request.security() function, see example code below
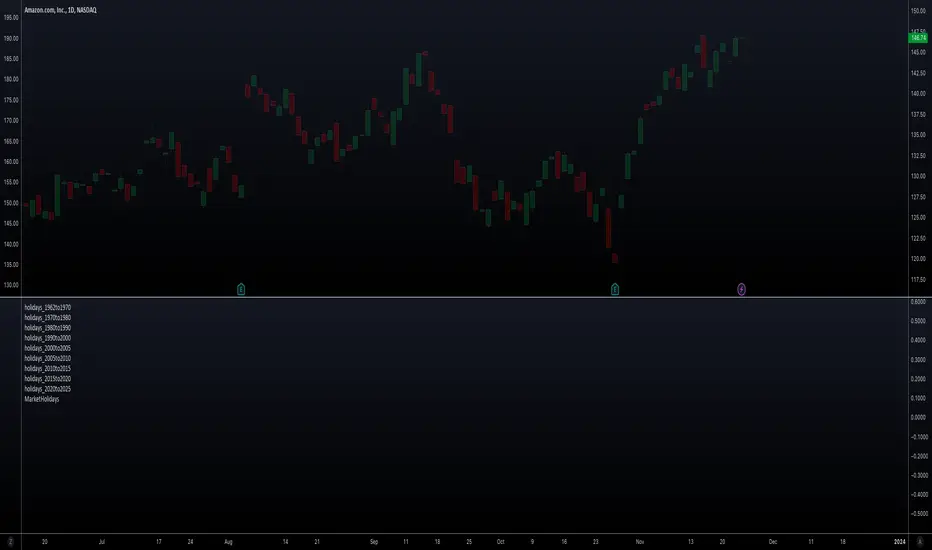
MarketHolidaysLibrary "MarketHolidays"
The MarketHolidays library compiles market holidays (including historical special market closures) into arrays, which can then be utilized in TradingView indicators and strategies to account for non-trading days. The datasets were split into different libraries to overcome compiling limitations, streamline the process of removing specific time frames if not needed, and to enhance code execution speed. The timestamps are generated using a custom Python script that employs the 'pandas_market_calendars' library. To build your own set of arrays, you can find the script and instructions at github.com
getHolidays(_country)
The getHolidays function aggregates holiday data from different time periods to create a single array with market holidays for a specified country.
Parameters:
_country (string) : The country code for which to retrieve market holidays. Accepts syminfo.country or pre-set country code in ISO 3166-1 alpha-2 format.
Returns: An array of timestamps of market holidays \ non-trading days for the given country.

holidays_2020to2025Library "holidays_2020to2025"
This dataset is part of my "MarketHolidays" library. The datasets were split into different libraries to overcome compiling limitations, streamline the process of removing specific time frames if not needed, and to enhance code execution speed. The timestamps are generated using a custom Python script that employs the 'pandas_market_calendars' library. To build your own set of arrays, you can find the script and instructions at github.com
holidays(_country)
Parameters:
_country (string)

holidays_2015to2020Library "holidays_2015to2020"
This dataset is part of my "MarketHolidays" library. The datasets were split into different libraries to overcome compiling limitations, streamline the process of removing specific time frames if not needed, and to enhance code execution speed. The timestamps are generated using a custom Python script that employs the 'pandas_market_calendars' library. To build your own set of arrays, you can find the script and instructions at github.com
holidays(_country)
Parameters:
_country (string)

holidays_2010to2015Library "holidays_2010to2015"
This dataset is part of my "MarketHolidays" library. The datasets were split into different libraries to overcome compiling limitations, streamline the process of removing specific time frames if not needed, and to enhance code execution speed. The timestamps are generated using a custom Python script that employs the 'pandas_market_calendars' library. To build your own set of arrays, you can find the script and instructions at github.com
holidays(_country)
Parameters:
_country (string)

holidays_2005to2010Library "holidays_2005to2010"
This dataset is part of my "MarketHolidays" library. The datasets were split into different libraries to overcome compiling limitations, streamline the process of removing specific time frames if not needed, and to enhance code execution speed. The timestamps are generated using a custom Python script that employs the 'pandas_market_calendars' library. To build your own set of arrays, you can find the script and instructions at github.com
holidays(_country)
Parameters:
_country (string)

holidays_2000to2005Library "holidays_2000to2005"
This dataset is part of my "MarketHolidays" library. The datasets were split into different libraries to overcome compiling limitations, streamline the process of removing specific time frames if not needed, and to enhance code execution speed. The timestamps are generated using a custom Python script that employs the 'pandas_market_calendars' library. To build your own set of arrays, you can find the script and instructions at github.com
holidays(_country)
Parameters:
_country (string)
holidays_1990to2000Library "holidays_1990to2000"
This dataset is part of my "MarketHolidays" library. The datasets were split into different libraries to overcome compiling limitations, streamline the process of removing specific time frames if not needed, and to enhance code execution speed. The timestamps are generated using a custom Python script that employs the 'pandas_market_calendars' library. To build your own set of arrays, you can find the script and instructions at github.com
holidays(_country)
Parameters:
_country (string)

holidays_1980to1990Library "holidays_1980to1990"
This dataset is part of my "MarketHolidays" library. The datasets were split into different libraries to overcome compiling limitations, streamline the process of removing specific time frames if not needed, and to enhance code execution speed. The timestamps are generated using a custom Python script that employs the 'pandas_market_calendars' library. To build your own set of arrays, you can find the script and instructions at github.com
holidays(_country)
Parameters:
_country (string)

holidays_1970to1980Library "holidays_1970to1980"
This dataset is part of my "MarketHolidays" library. The datasets were split into different libraries to overcome compiling limitations, streamline the process of removing specific time frames if not needed, and to enhance code execution speed. The timestamps are generated using a custom Python script that employs the 'pandas_market_calendars' library. To build your own set of arrays, you can find the script and instructions at github.com
holidays(_country)
Parameters:
_country (string)

holidays_1962to1970Library "holidays_1962to1970"
This dataset is part of my "MarketHolidays" library. The datasets were split into different libraries to overcome compiling limitations, streamline the process of removing specific time frames if not needed, and to enhance code execution speed. The timestamps are generated using a custom Python script that employs the 'pandas_market_calendars' library. To build your own set of arrays, you can find the script and instructions at github.com
holidays(_country)
Parameters:
_country (string)

chrono_utilsLibrary "chrono_utils"
📝 Description
Collection of objects and common functions that are related to datetime windows session days and time ranges. The main purpose of this library is to handle time-related functionality and make it easy to reason about a future bar checking if it will be part of a predefined session and/or inside a datetime window. All existing session functionality I found in the documentation e.g. "not na(time(timeframe, session, timezone))" are not suitable for strategy scripts, since the execution of the orders is delayed by one bar, due to the script execution happening at the bar close. Moreover, a history operator with a negative value that looks forward is not allowed in any pinescript expression. So, a prediction for the next bar using the bars_back argument of "time()"" and "time_close()" was necessary. Thus, I created this library to overcome this small but very important limitation. In the meantime, I added useful functionality to handle session-based behavior. An interesting utility that emerged from this development is data anomaly detection where a comparison between the prediction and the actual value is happening. If those two values are different then a data inconsistency happens between the prediction bar and the actual bar (probably due to a holiday, half session day, a timezone change etc..)
🤔 How to Guide
To use the functionality this library provides in your script you have to import it first!
Copy the import statement of the latest release by pressing the copy button below and then paste it into your script. Give a short name to this library so you can refer to it later on. The import statement should look like this:
import jason5480/chrono_utils/2 as chr
To check if a future bar will be inside a window first of all you have to initialize a DateTimeWindow object.
A code example is the following:
var dateTimeWindow = chr.DateTimeWindow.new().init(fromDateTime = timestamp('01 Jan 2023 00:00'), toDateTime = timestamp('01 Jan 2024 00:00'))
Then you have to "ask" the dateTimeWindow if the future bar defined by an offset (default is 1 that corresponds th the next bar), will be inside that window:
// Filter bars outside of the datetime window
bool dateFilterApproval = dateTimeWindow.is_bar_included()
You can visualize the result by drawing the background of the bars that are outside the given window:
bgcolor(color = dateFilterApproval ? na : color.new(color.fuchsia, 90), offset = 1, title = 'Datetime Window Filter')
In the same way, you can "ask" the Session if the future bar defined by an offset it will be inside that session.
First of all, you should initialize a Session object.
A code example is the following:
var sess = chr.Session.new().from_sess_string(sess = '0800-1700:23456', refTimezone = 'UTC')
Then check if the given bar defined by the offset (default is 1 that corresponds th the next bar), will be inside the session like that:
// Filter bars outside the sessions
bool sessionFilterApproval = view.sess.is_bar_included()
You can visualize the result by drawing the background of the bars that are outside the given session:
bgcolor(color = sessionFilterApproval ? na : color.new(color.red, 90), offset = 1, title = 'Session Filter')
In case you want to visualize multiple session ranges you can create a SessionView object like that:
var view = SessionView.new().init(SessionDays.new().from_sess_string('2345'), array.from(SessionTimeRange.new().from_sess_string('0800-1600'), SessionTimeRange.new().from_sess_string('1300-2200')), array.from('London', 'New York'), array.from(color.blue, color.orange))
and then call the draw method of the SessionView object like that:
view.draw()
🏋️♂️ Please refer to the "EXAMPLE DATETIME WINDOW FILTER" and "EXAMPLE SESSION FILTER" regions of the script for more advanced code examples of how to utilize the full potential of this library, including user input settings and advanced visualization!
⚠️ Caveats
As I mentioned in the description there are some cases that the prediction of the next bar is not accurate. A wrong prediction will affect the outcome of the filtering. The main reasons this could happen are the following:
Public holidays when the market is closed
Half trading days usually before public holidays
Change in the daylight saving time (DST)
A data anomaly of the chart, where there are missing and/or inconsistent data.
A bug in this library (Please report by PM sending the symbol, timeframe, and settings)
Special thanks to @robbatt and @skinra for the constructive feedback 🏆. Without them, the exposed API of this library would be very lengthy and complicated to use. Thanks to them, now the user of this library will be able to get the most, with only a few lines of code!

SessionVolumeProfileLibrary "SessionVolumeProfile"
Analyzes price & volume during regular trading hours to provide a session volume profile analysis. The primary goal of this library is to provide the developer with three values: the value area high, low and the point of control. The library also provides methods for rendering the value areas and histograms. To learn more about this library and how you can use it, click on the website link in my profile where you will find a blog post with detailed information.
debug(vp, position)
Helper function to write some information about the supplied SVP object to the screen in a table.
Parameters:
vp (Object) : The SVP object to debug
position (string) : The position.* to place the table. Defaults to position.bottom_center
getLowerTimeframe()
Depending on the timeframe of the chart, determines a lower timeframe to grab volume data from for the analysis
Returns: The timeframe string to fetch volume for
get(volumeProfile, lowerTimeframeHigh, lowerTimeframeLow, lowerTimeframeVolume)
Populated the provided SessionVolumeProfile object with vp data on the session.
Parameters:
volumeProfile (Object) : The SessionVolumeProfile object to populate
lowerTimeframeHigh (float ) : The lower timeframe high values
lowerTimeframeLow (float ) : The lower timeframe low values
lowerTimeframeVolume (float ) : The lower timeframe volume values
drawPriorValueAreas(todaySessionVolumeProfile, extendYesterdayOverToday, showLabels, labelSize, pocColor, pocStyle, pocWidth, vahlColor, vahlStyle, vahlWidth, vaColor)
Given a SessionVolumeProfile Object, will render the historical value areas for that object.
Parameters:
todaySessionVolumeProfile (Object) : The SessionVolumeProfile Object to draw
extendYesterdayOverToday (bool) : Defaults to true
showLabels (bool) : Defaults to true
labelSize (string) : Defaults to size.small
pocColor (color) : Defaults to #e500a4
pocStyle (string) : Defaults to line.style_solid
pocWidth (int) : Defaults to 1
vahlColor (color) : The color of the value area high/low lines. Defaults to #1592e6
vahlStyle (string) : The style of the value area high/low lines. Defaults to line.style_solid
vahlWidth (int) : The width of the value area high/low lines. Defaults to 1
vaColor (color) : The color of the value area background. Defaults to #00bbf911)
drawHistogram(volumeProfile, bgColor, showVolumeOnHistogram)
Given a SessionVolumeProfile object, will render the histogram for that object.
Parameters:
volumeProfile (Object) : The SessionVolumeProfile object to draw
bgColor (color) : The baseline color to use for the histogram. Defaults to #00bbf9
showVolumeOnHistogram (bool) : Show the volume amount on the histogram bars. Defaults to false.
Object
Fields:
numberOfRows (series__integer)
valueAreaCoverage (series__integer)
trackDevelopingVa (series__bool)
valueAreaHigh (series__float)
pointOfControl (series__float)
valueAreaLow (series__float)
startTime (series__integer)
endTime (series__integer)
dayHigh (series__float)
dayLow (series__float)
step (series__float)
pointOfControlLevel (series__integer)
valueAreaHighLevel (series__integer)
valueAreaLowLevel (series__integer)
volumeRows (array__float)
priceLevelRows (array__float)
ltfSessionHighs (array__float)
ltfSessionLows (array__float)
ltfSessionVols (array__float)
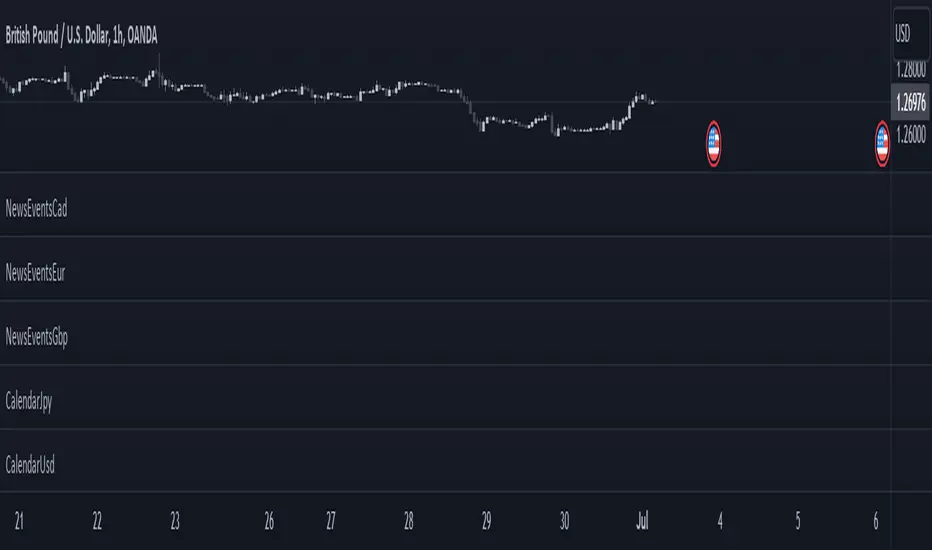
CalendarCadLibrary "CalendarCad"
This library provides date and time data of the important events on CAD. Data source is csv exported from www.fxstreet.com and transformed into perfered format by C# script.
HighImpactNews2015To2023()
CAD high impact news date and time from 2015 to 2023

CalendarEurLibrary "CalendarEur"
This library provides date and time data of the important events on EUR. Data source is csv exported from www.fxstreet.com and transformed into perfered format by C# script.
HighImpactNews2015To2019()
EUR high impact news date and time from 2015 to 2019
HighImpactNews2020To2023()
EUR high impact news date and time from 2020 to 2023
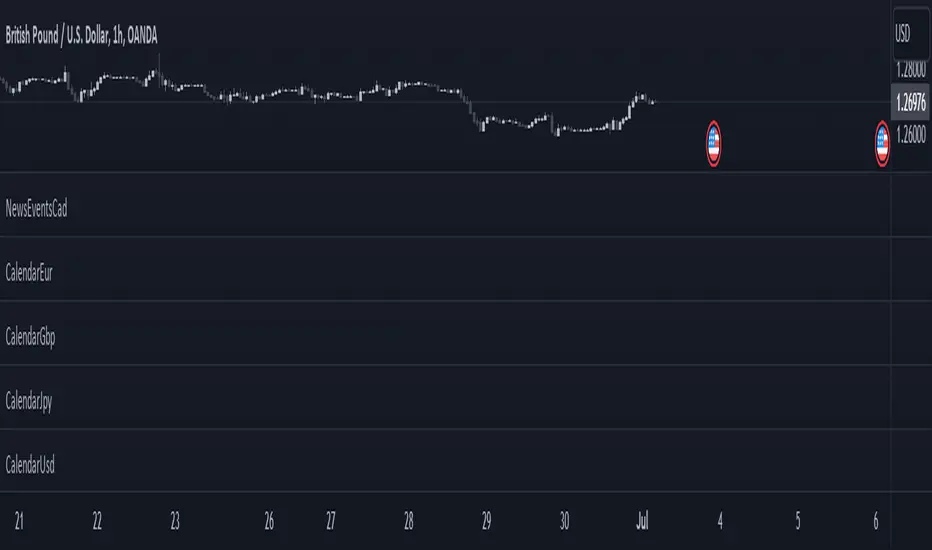
CalendarGbpLibrary "CalendarGbp"
This library provides date and time data of the important events on GBP. Data source is csv exported from www.fxstreet.com and transformed into perfered format by C# script.
HighImpactNews2015To2019()
GBP high impact news date and time from 2015 to 2019
HighImpactNews2020To2023()
GBP high impact news date and time from 2020 to 2023

CalendarJpyLibrary "CalendarJpy"
This library provides date and time data of the important events on JPY. Data source is csv exported from www.fxstreet.com and transformed into perfered format by C# script.
HighImpactNews2015To2023()
JPY high impact news date and time from 2015 to 2023