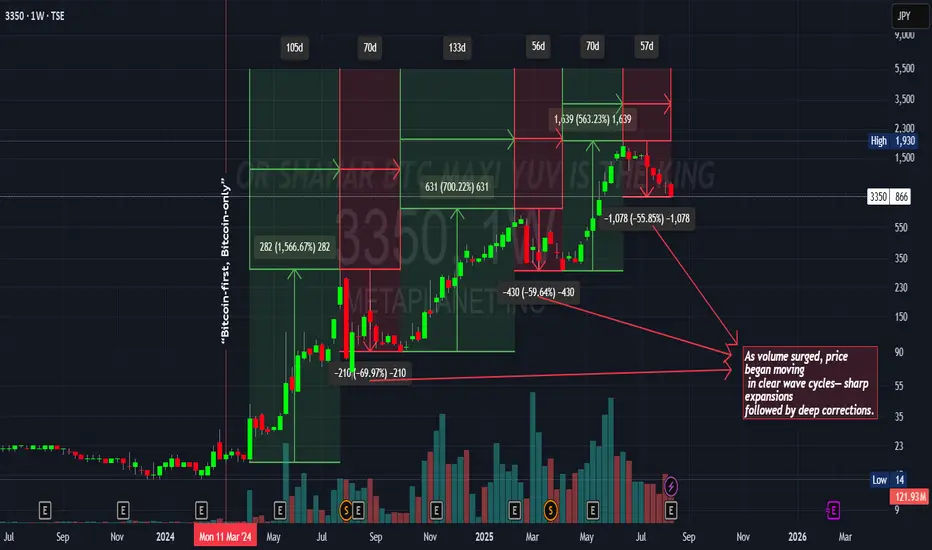
This chart highlights how price action developed in distinct wave cycles once volume surged.
Each expansion phase was sharp, delivering multi-hundred percent gains in relatively short periods.
These expansions were consistently followed by deep corrective pullbacks of 50–70%.
The repeating rhythm shows a market structure of accumulation → expansion → correction → continuation.
Overall, the cycles emphasize the importance of recognizing both momentum opportunities and the inevitable retracements that followed.
כתב ויתור
המידע והפרסומים אינם מיועדים להיות, ואינם מהווים, ייעוץ או המלצה פיננסית, השקעתית, מסחרית או מכל סוג אחר המסופקת או מאושרת על ידי TradingView. קרא עוד ב־תנאי השימוש.
כתב ויתור
המידע והפרסומים אינם מיועדים להיות, ואינם מהווים, ייעוץ או המלצה פיננסית, השקעתית, מסחרית או מכל סוג אחר המסופקת או מאושרת על ידי TradingView. קרא עוד ב־תנאי השימוש.