Aarti Industries – Weekly Chart Update
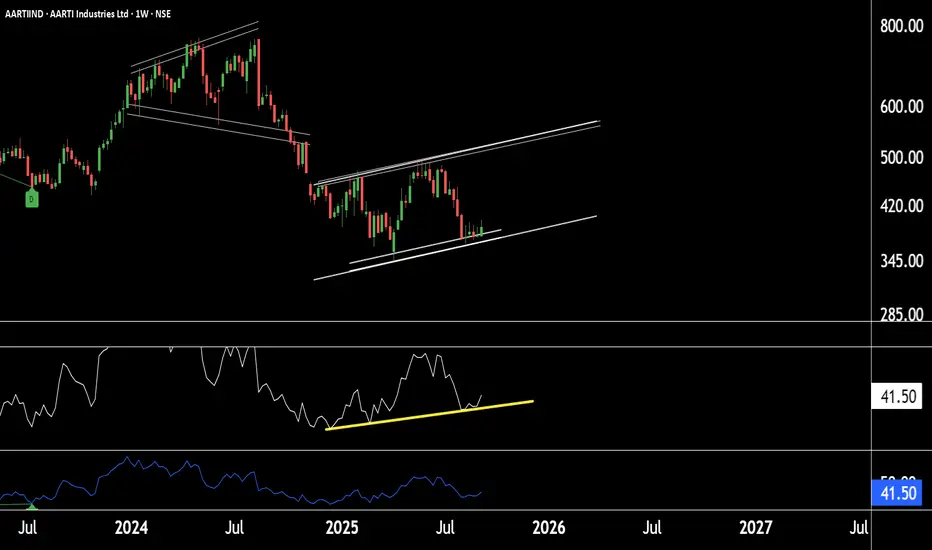
Chart Pattern: Stock is trading within a shorter-timeframe parallel channel.
Support Zone: Strong support observed near ₹370 – ₹380 levels.
RSI Indicator: RSI is also taking support and moving upward, indicating positive momentum.
Trend Outlook: If this support zone sustains, the stock is likely to move into an uptrend.
Price Projection: Potential for higher levels at 500-521 in Aarti Industries.
Thank you!
@RahulSaraoge
Connect us at t.me/stridesadvisory
Connect us at t.me/stridesadvisory
כתב ויתור
המידע והפרסומים אינם אמורים להיות, ואינם מהווים, עצות פיננסיות, השקעות, מסחר או סוגים אחרים של עצות או המלצות שסופקו או מאושרים על ידי TradingView. קרא עוד בתנאים וההגבלות.
@RahulSaraoge
Connect us at t.me/stridesadvisory
Connect us at t.me/stridesadvisory
כתב ויתור
המידע והפרסומים אינם אמורים להיות, ואינם מהווים, עצות פיננסיות, השקעות, מסחר או סוגים אחרים של עצות או המלצות שסופקו או מאושרים על ידי TradingView. קרא עוד בתנאים וההגבלות.