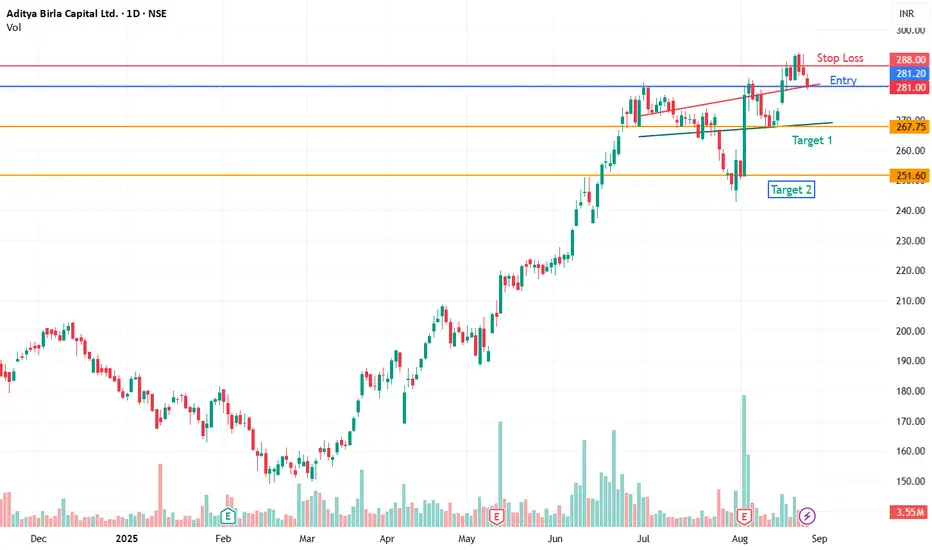
Current Price: ₹281.00
RSI (Relative Strength Index): 55.43 → Neutral to slightly bullish (above 50 but below 70).
✅ Support and Resistance
Supports:
S1: ₹268.00
S2: ₹271.35
S3: ₹271.60
Price is holding above key supports, which provides a cushion for buyers.
Resistances:
R1: ₹282.65
R2: ₹284.00
R3: ₹289.60
Stock is near immediate resistance (₹282–284 zone). Breakout above ₹289.60 could open higher levels.
✅ Fibonacci Levels
23.6%: ₹113.36
38.2%: ₹147.57
50.0%: ₹175.22
61.8%: ₹202.88
78.6%: ₹242.25
Current price (₹281) is well above the 78.6% retracement, indicating strong recovery and continuation of the uptrend.
✅ Moving Averages
Short-Term:
EMA5 = ₹283.68, SMA5 = ₹285.46 → Price slightly below → mild short-term weakness.
EMA9 = ₹281.96, SMA9 = ₹282.28 → Price hovering around → neutral.
Medium-Term:
EMA20 = ₹276.99, SMA20 = ₹273.83 → Price above → bullish medium-term bias.
Long-Term:
EMA50 = ₹265.27, SMA50 = ₹270.89 → Price above both → strength in broader trend.
EMA100 = ₹246.26, SMA100 = ₹240.71 → Price above → long-term bullish trend.
EMA200 = ₹226.74, SMA200 = ₹209.18 → Price well above → strong bullish structure.
כתב ויתור
המידע והפרסומים אינם מיועדים להיות, ואינם מהווים, ייעוץ או המלצה פיננסית, השקעתית, מסחרית או מכל סוג אחר המסופקת או מאושרת על ידי TradingView. קרא עוד ב־תנאי השימוש.
כתב ויתור
המידע והפרסומים אינם מיועדים להיות, ואינם מהווים, ייעוץ או המלצה פיננסית, השקעתית, מסחרית או מכל סוג אחר המסופקת או מאושרת על ידי TradingView. קרא עוד ב־תנאי השימוש.