ACAMD to target 1.12 then 1.40 after crossing Resistance
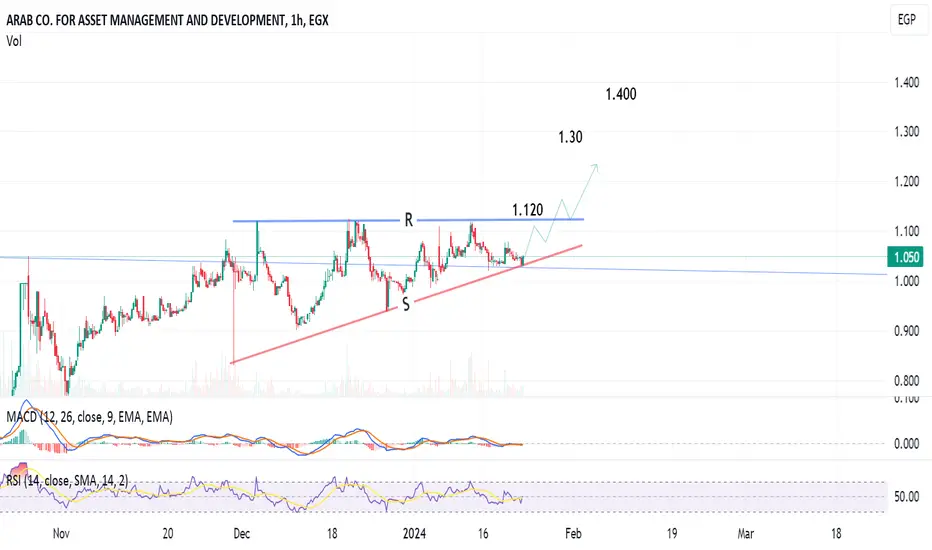
1-hour chart, the stock is trading in a rising triangle pattern, going to hit the Resistance line (blue) at around 1.118 - 1.120.
After crossing up, the target will be 1.30 then 1.40
Stop loss below the support line.
After crossing up, the target will be 1.30 then 1.40
Stop loss below the support line.
פרסומים קשורים
כתב ויתור
המידע והפרסומים אינם אמורים להיות, ואינם מהווים, עצות פיננסיות, השקעות, מסחר או סוגים אחרים של עצות או המלצות שסופקו או מאושרים על ידי TradingView. קרא עוד בתנאים וההגבלות.
כתב ויתור
המידע והפרסומים אינם אמורים להיות, ואינם מהווים, עצות פיננסיות, השקעות, מסחר או סוגים אחרים של עצות או המלצות שסופקו או מאושרים על ידי TradingView. קרא עוד בתנאים וההגבלות.