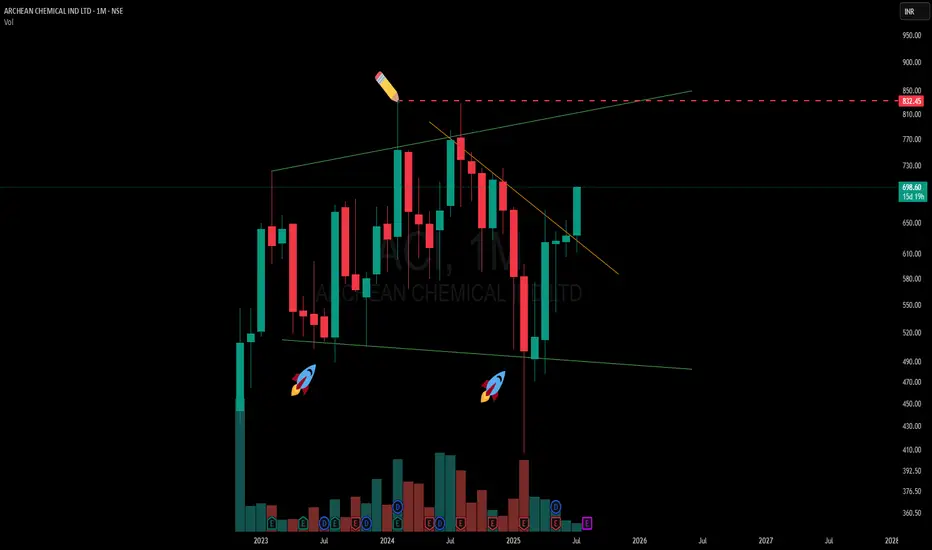
🟢A classic case of a broadening formation playing out on the higher timeframe (MTF). The green lines represent the broadening range, with price recently respecting the lower boundary — evident from the two support touches marked with 🚀 icons, each forming slightly lower lows before rebounding.
🟢 The current candle is testing a counter-trend (CT) descending trendline breakout, visible clearly after a prolonged series of lower highs. While the candle is still in progress and hasn’t closed, the structure is showing signs of compression toward the mid-zone of the broadening pattern.
📌 Upper and lower spaces remain open, highlighting the broad-range volatility typical of this setup.
No forecast — just structure. 📊
🎯 Master My Self-Made Trading Strategy
📈 Telegram (Learn Today): t.me/hashtaghammer
✅ WhatsApp (Learn Today): wa.me/919455664601
📈 Telegram (Learn Today): t.me/hashtaghammer
✅ WhatsApp (Learn Today): wa.me/919455664601
פרסומים קשורים
כתב ויתור
המידע והפרסומים אינם מיועדים להיות, ואינם מהווים, ייעוץ או המלצה פיננסית, השקעתית, מסחרית או מכל סוג אחר המסופקת או מאושרת על ידי TradingView. קרא עוד ב־תנאי השימוש.