Cardano (ADA) technical analysis:
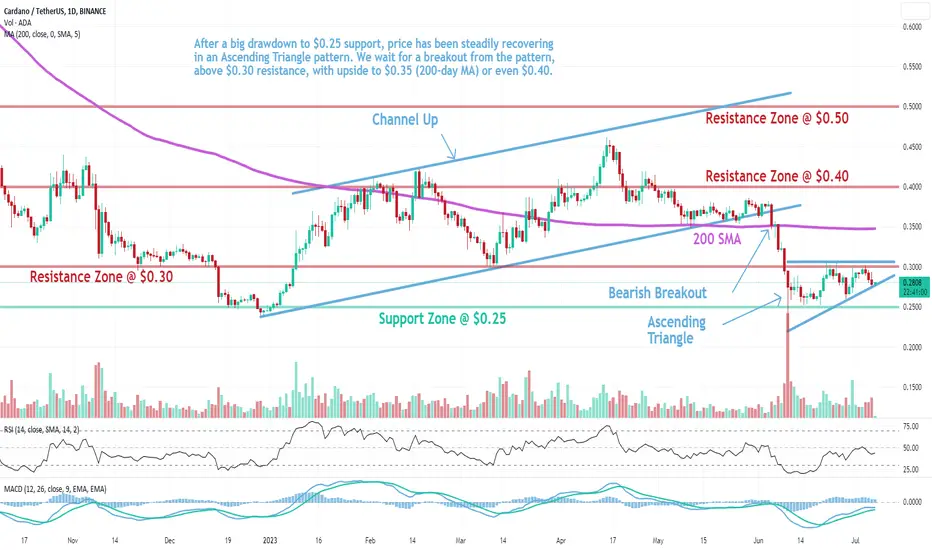
Trade setup: After a big drawdown to $0.25 support, price has been steadily recovering in an Ascending Triangle pattern. We wait for a breakout from the pattern, above $0.30 resistance, with upside to $0.35 (200-day MA) or even $0.40.
Trend: Downtrend across all time horizons (Short- Medium- and Long-Term).
Momentum is Mixed as MACD Line is above MACD Signal Line (Bullish) but RSI < 45 (Bearish). MACD Histogram bars are declining, which suggests that momentum is weakening.
Support and Resistance: Nearest Support Zone is $0.25. The nearest Resistance Zone is $0.30 (previous support), then $0.40, and $0.50.
כתב ויתור
המידע והפרסומים אינם מיועדים להיות, ואינם מהווים, ייעוץ או המלצה פיננסית, השקעתית, מסחרית או מכל סוג אחר המסופקת או מאושרת על ידי TradingView. קרא עוד ב־תנאי השימוש.
כתב ויתור
המידע והפרסומים אינם מיועדים להיות, ואינם מהווים, ייעוץ או המלצה פיננסית, השקעתית, מסחרית או מכל סוג אחר המסופקת או מאושרת על ידי TradingView. קרא עוד ב־תנאי השימוש.