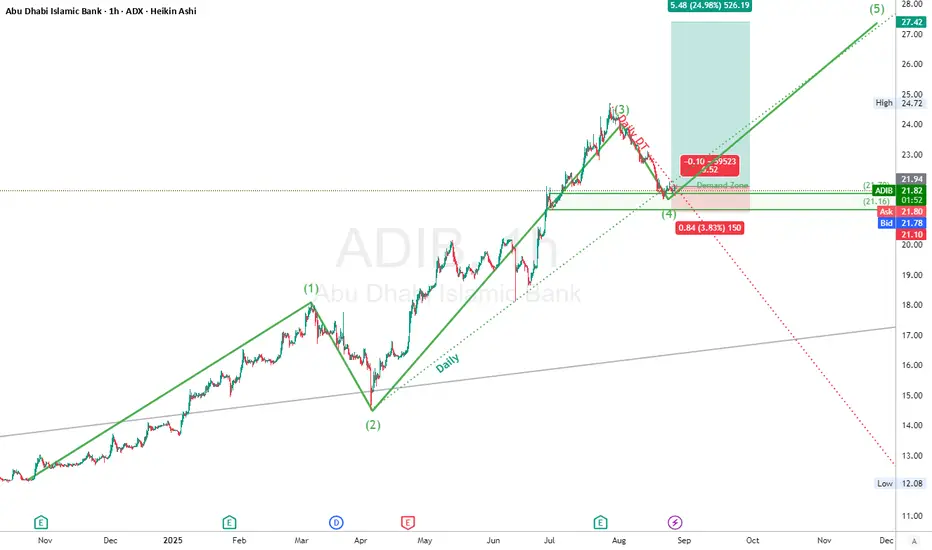
ADIB is showing textbook Elliott Wave behavior. After a strong impulsive wave structure into wave (3), price corrected cleanly into the **Demand Zone** and held above the key support at **21.16** – right in line with a classic wave (4) retracement.
The drop into this zone followed a **bullish descending channel (bullish DT)**, indicating exhaustion of sellers and potential reaccumulation. Price is now rebounding from this base, suggesting wave (5) may just be starting.
A beautiful confluence of:
* Fib levels,
* Demand zone,
* Channel breakout,
* Wave (4) support.
The bulls are stepping in. This is **prime positioning**.
### 🟩 **Demand Zone**
* Key Zone: **21.10–21.78 AED**
* Clean support on both price structure and psychology; price wicked into zone but rejected downside.
### 🎯 **Trade Idea**
* **Entry**: 21.70–21.80 AED (current levels)
* **Stop Loss**: 21.10 AED (beneath structure low)
* **Take Profit**: 27.42 AED (projected wave (5) target)
* **Risk/Reward**: \~5.48R
"The market is a device for transferring money from the impatient to the patient." – Warren Buffett
### ⚠️ **Disclaimer**
This is not financial advice. Always perform your own analysis and manage your risk accordingly. This is for educational purposes only.
By Dubai Traders Hub
Follow us on X , YouTube, and Join our Telegram Channel
Follow us on X , YouTube, and Join our Telegram Channel
כתב ויתור
המידע והפרסומים אינם מיועדים להיות, ואינם מהווים, ייעוץ או המלצה פיננסית, השקעתית, מסחרית או מכל סוג אחר המסופקת או מאושרת על ידי TradingView. קרא עוד ב־תנאי השימוש.