(AFDI)
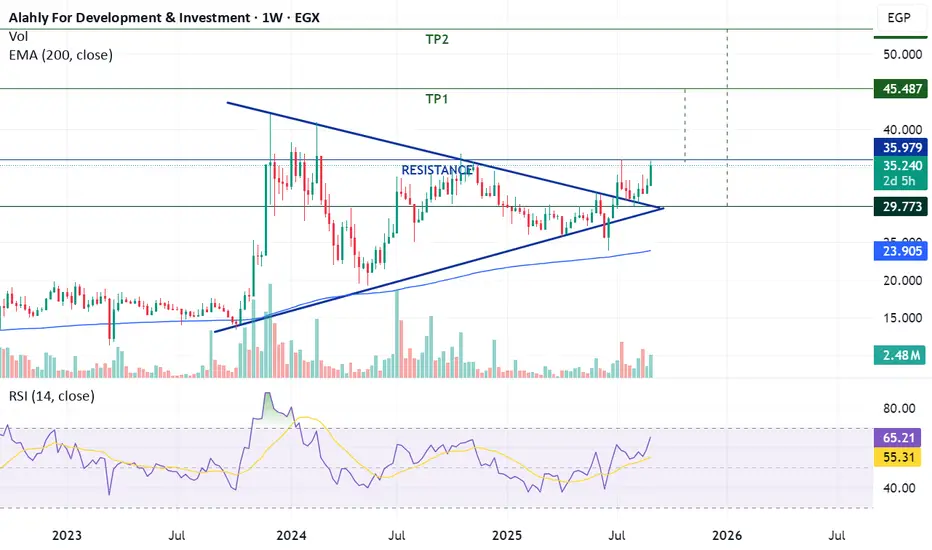
The stock previously formed a symmetrical triangle, which was successfully broken on July 9. On the weekly chart, a clear Cup & Handle pattern has also developed.
If the price breaks above 35.8 and sustains, this would validate the pattern and open the way for the following medium- to long-term targets: 45 – 53.
⚠ The stop-loss level after a confirmed breakout is set at 35.5.
Trade Setup:
-Stock Code: AFDI
-Potential Buy Range: 35.8 – 36.8
-Target Price 1 (TP1): 45
-Target Price 2 (TP2): 53
-Stop-Loss (SL): 35.5 after breakout
כתב ויתור
המידע והפרסומים אינם מיועדים להיות, ואינם מהווים, ייעוץ או המלצה פיננסית, השקעתית, מסחרית או מכל סוג אחר המסופקת או מאושרת על ידי TradingView. קרא עוד ב־תנאי השימוש.
כתב ויתור
המידע והפרסומים אינם מיועדים להיות, ואינם מהווים, ייעוץ או המלצה פיננסית, השקעתית, מסחרית או מכל סוג אחר המסופקת או מאושרת על ידי TradingView. קרא עוד ב־תנאי השימוש.