📉 ALAB Technical Outlook – Descending Channel in Play
Ticker: ALAB
Timeframe: (30m candles shown)
🔍 Current Setup
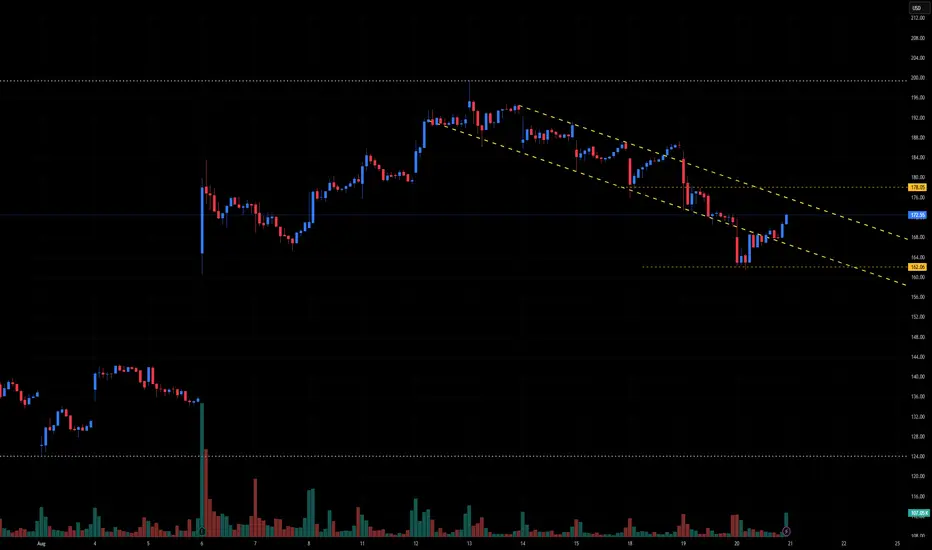
ALAB is trading inside a falling channel (downtrend channel) marked by parallel descending resistance and support lines. Price has recently bounced from the lower boundary near 164–166, but remains capped by overhead resistance at the channel top near 178.
This setup suggests traders are watching for either:
A channel breakout to the upside (bullish reversal).
A continuation of the downtrend if resistance holds.
📊 Breakout Levels
🚀 Upside (Bullish Scenario)
Trigger: Close above 178.00–179.00 (channel resistance).
Intermediate Targets:
184.00–185.00 → Prior reaction high
192.00 → Channel midpoint supply
Measured Move Target: ~197–200 (equal to channel height projection).
🔻 Downside (Bearish Scenario)
Trigger: Close below 164.00–162.00 (channel support).
Intermediate Supports:
156.00 → Previous pivot zone
150.00 → Round number support
Measured Move Target: ~145 (channel height projection).
📈 Volume Analysis
Note the surge in volume on the most recent bounce off support.
Rising volume at channel edges often precedes breakouts. If this buying strength continues, bulls may attempt to reclaim 178+ for a trend reversal.
⚖️ Probability Bias
Bears remain in control while price trades inside the descending channel.
However, the volume spike off support suggests bulls are testing momentum.
A breakout above 178 could mark a trend reversal, but failure there would likely result in another leg lower toward 162.
✅ Takeaway
The battle is clear:
Bullish Break > 178: Targets 184 → 192 → 197–200
Bearish Break < 164–162: Targets 156 → 150 → 145
Until then, expect continued channel trading with resistance near 178 and support near 164.
Ticker: ALAB
Timeframe: (30m candles shown)
🔍 Current Setup
ALAB is trading inside a falling channel (downtrend channel) marked by parallel descending resistance and support lines. Price has recently bounced from the lower boundary near 164–166, but remains capped by overhead resistance at the channel top near 178.
This setup suggests traders are watching for either:
A channel breakout to the upside (bullish reversal).
A continuation of the downtrend if resistance holds.
📊 Breakout Levels
🚀 Upside (Bullish Scenario)
Trigger: Close above 178.00–179.00 (channel resistance).
Intermediate Targets:
184.00–185.00 → Prior reaction high
192.00 → Channel midpoint supply
Measured Move Target: ~197–200 (equal to channel height projection).
🔻 Downside (Bearish Scenario)
Trigger: Close below 164.00–162.00 (channel support).
Intermediate Supports:
156.00 → Previous pivot zone
150.00 → Round number support
Measured Move Target: ~145 (channel height projection).
📈 Volume Analysis
Note the surge in volume on the most recent bounce off support.
Rising volume at channel edges often precedes breakouts. If this buying strength continues, bulls may attempt to reclaim 178+ for a trend reversal.
⚖️ Probability Bias
Bears remain in control while price trades inside the descending channel.
However, the volume spike off support suggests bulls are testing momentum.
A breakout above 178 could mark a trend reversal, but failure there would likely result in another leg lower toward 162.
✅ Takeaway
The battle is clear:
Bullish Break > 178: Targets 184 → 192 → 197–200
Bearish Break < 164–162: Targets 156 → 150 → 145
Until then, expect continued channel trading with resistance near 178 and support near 164.
עסקה פעילה
ROCKETSHIP RESULTS MUCH HIGHERכתב ויתור
המידע והפרסומים אינם מיועדים להיות, ואינם מהווים, ייעוץ או המלצה פיננסית, השקעתית, מסחרית או מכל סוג אחר המסופקת או מאושרת על ידי TradingView. קרא עוד ב־תנאי השימוש.
כתב ויתור
המידע והפרסומים אינם מיועדים להיות, ואינם מהווים, ייעוץ או המלצה פיננסית, השקעתית, מסחרית או מכל סוג אחר המסופקת או מאושרת על ידי TradingView. קרא עוד ב־תנאי השימוש.