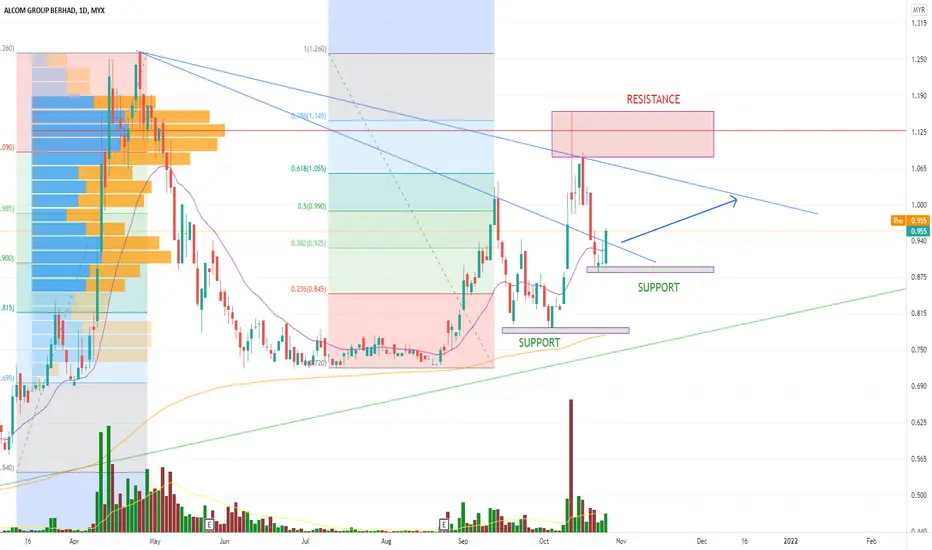
Technical analysis for ALCOM Stock based on Trend Analysis, Chart Pattern and Fibonacci Retracement
הערה
Current price candle has break the immediate support line. Price candle 8 Nov 21 show Demand Test Candle with low volume-positive result. Price may move lower to next support line at 0.790.עסקה סגורה: הגיע לסטופ
This stock lost momentum, don' take position in this stockAHI
כתב ויתור
המידע והפרסומים אינם אמורים להיות, ואינם מהווים, עצות פיננסיות, השקעות, מסחר או סוגים אחרים של עצות או המלצות שסופקו או מאושרים על ידי TradingView. קרא עוד בתנאים וההגבלות.
AHI
כתב ויתור
המידע והפרסומים אינם אמורים להיות, ואינם מהווים, עצות פיננסיות, השקעות, מסחר או סוגים אחרים של עצות או המלצות שסופקו או מאושרים על ידי TradingView. קרא עוד בתנאים וההגבלות.