Current Structure & Momentum
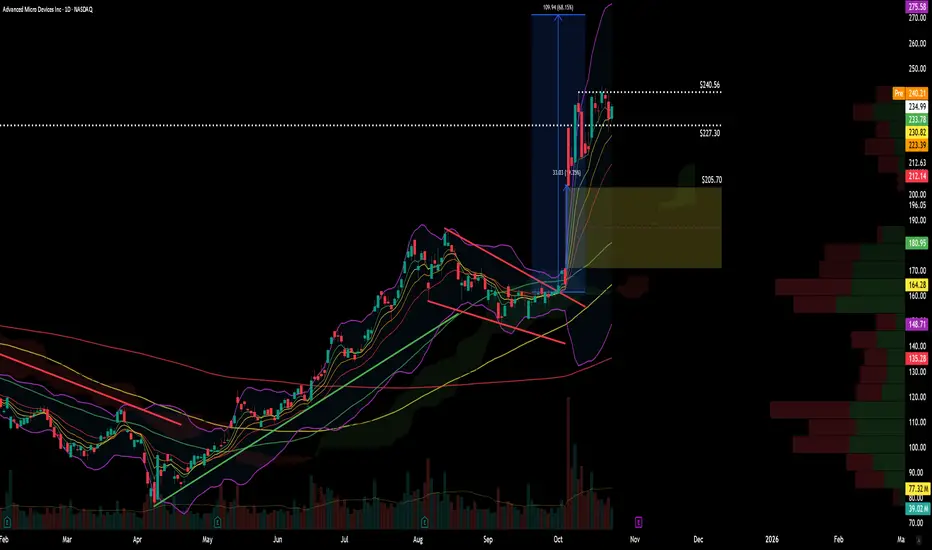
After a 90% rally YTD, price has now run into congestion near $240, which aligns with prior resistance and psychological round-number supply. Despite that, AMD continues to hold the 8-day moving average, indicating that short-term momentum remains intact and buyers are still in control.
Watch for how price reacts around the 13-day and 21-day MAs:
Holding above the 8-day → momentum intact.
Break below the 13-day → short-term pause or cooling phase.
Decisive close below the 21-day → potential trim/take-profit zone before reassessing.
The trend remains bullish until proven otherwise — let the chart tell its story before making assumptions.
Gap Zone & Risk Levels
The October breakout left a significant unfilled gap, a key reference area for potential re-tests if market sentiment turns.
Gap mid-point (~$186) marks a 50% retrace zone — a logical first level for dip buyers if AI or semiconductor sentiment weakens.
As long as price holds above $205–$210, the breakout structure remains valid.
A full gap fill would only become likely on heavy distribution or macro risk-off rotation across tech.
So far, the gap has not been filled, underscoring the underlying strength of the move.
Volume & Target Projection
Volume supported the breakout, confirming institutional participation and validating the pattern. Using a 1:1 flagpole measured move, the projected target for the breakout sits around $275 — which also aligns with the next visible volume-profile node on higher timeframes.
Summary
✅ Trend: Bullish continuation
✅ Momentum: Holding 8-day EMA → strong
⚠️ Risk line: Close below 21-day MA → trim/reevaluate
🎯 Target: ~$275 (flagpole 1:1 projection)
📊 Gap zone: Watch $186–$205 for any retrace reactions
Final Notes
Momentum remains in AMD’s favor as long as short-term EMAs hold and sector sentiment supports the move. Watch how the stock behaves into $240 — acceptance above turns that zone into potential new support, opening the path to $260–$275.
For educational and technical analysis purposes only.
#Stocks #Crypto #TA #Semiconductors #NASDAQ
כתב ויתור
המידע והפרסומים אינם מיועדים להיות, ואינם מהווים, ייעוץ או המלצה פיננסית, השקעתית, מסחרית או מכל סוג אחר המסופקת או מאושרת על ידי TradingView. קרא עוד ב־תנאי השימוש.
כתב ויתור
המידע והפרסומים אינם מיועדים להיות, ואינם מהווים, ייעוץ או המלצה פיננסית, השקעתית, מסחרית או מכל סוג אחר המסופקת או מאושרת על ידי TradingView. קרא עוד ב־תנאי השימוש.