Looking at the daily chart of AMGN, here’s the outlook:
📊 Short-Term Outlook (1–4 weeks)
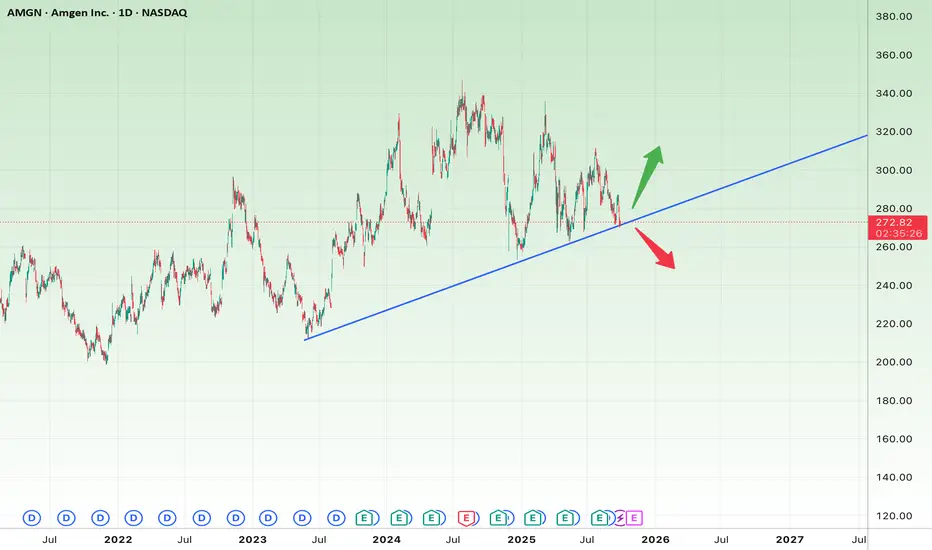
Price Structure: The stock is testing a long-term ascending trendline (blue line). This level has repeatedly acted as strong support since early 2023.
Risk: If buyers fail to defend the trendline, a breakdown could trigger further downside momentum.
Key Support: $270 (trendline + psychological level).
Short-Term Stop Loss: Below $265 on a confirmed daily close.
Short-Term Target: If support holds, a rebound toward $290–300 is likely.
➡️ As long as price stays above $270, the short-term bias favors a bounce.
📊 Long-Term Outlook (2–6 months)
Primary Trend: Long-term uptrend is intact, supported by the ascending trendline since 2022.
Major Support Zone: $265–260 (if broken, the structure weakens significantly).
Long-Term Stop Loss: Below $260 (confirmed close).
Long-Term Targets:
First target: $310 (previous swing highs).
Next target: $330–335 if momentum continues.
➡️ Long-term bullish as long as AMGN respects the $260 support area.
🎯 Summary
Short-Term Trade Idea: Buy near $270 support with a target of $290–300, stop loss at $265.
Long-Term Position: Hold above $260 with upside targets at $310 and $330–335.
כתב ויתור
המידע והפרסומים אינם אמורים להיות, ואינם מהווים, עצות פיננסיות, השקעות, מסחר או סוגים אחרים של עצות או המלצות שסופקו או מאושרים על ידי TradingView. קרא עוד בתנאים וההגבלות.
כתב ויתור
המידע והפרסומים אינם אמורים להיות, ואינם מהווים, עצות פיננסיות, השקעות, מסחר או סוגים אחרים של עצות או המלצות שסופקו או מאושרים על ידי TradingView. קרא עוד בתנאים וההגבלות.