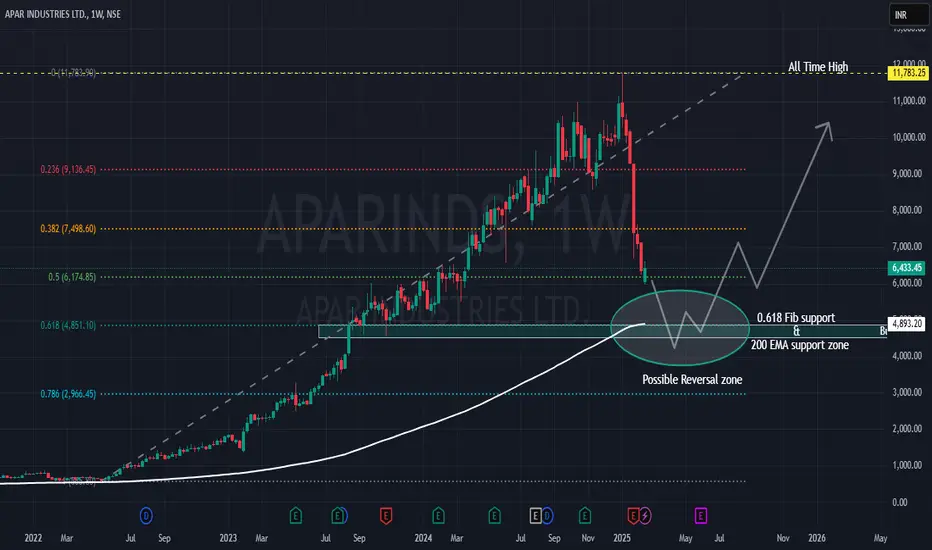
The weekly chart of *APAR Industries (APARINDS) suggests a potential reversal setup as the price approaches a critical confluence of support zones. After a strong upward rally, the stock is undergoing a healthy correction, which could provide an opportunity for long-term investors or swing traders.
Key Observations:
1. Fibonacci Retracement Support:
- The price is nearing the 0.618 Fibonacci retracement level, a key level often respected in trending markets.
2. 200-Week EMA Support:
- The 200-week EMA aligns closely with the Fibonacci level, adding further strength to this zone as potential support.
3. Reversal Zone Highlighted:
- The green rectangle zone marks the support zone suggesting a high probability of reversal.
So, APAR Industries (APARINDS) is approaching a critical support zone defined by the confluence of the 0.618 Fibonacci retracement and the 200-week EMA. This area has historically acted as strong support and could provide an excellent opportunity for long trades if bullish signals emerge. Let me know your thoughts in the comments! #APARINDS #TechnicalAnalysis #SwingTrading"
---
Disclaimer:
This analysis is for informational and educational purposes only and does not constitute financial advice. Trading and investing involve significant risk of loss. Always conduct your own research and consult with a qualified financial advisor before making any investment decisions.
כתב ויתור
המידע והפרסומים אינם מיועדים להיות, ואינם מהווים, ייעוץ או המלצה פיננסית, השקעתית, מסחרית או מכל סוג אחר המסופקת או מאושרת על ידי TradingView. קרא עוד ב־תנאי השימוש.
כתב ויתור
המידע והפרסומים אינם מיועדים להיות, ואינם מהווים, ייעוץ או המלצה פיננסית, השקעתית, מסחרית או מכל סוג אחר המסופקת או מאושרת על ידי TradingView. קרא עוד ב־תנאי השימוש.