APL Apollo – Chart Analysis
The structure is quite clear:
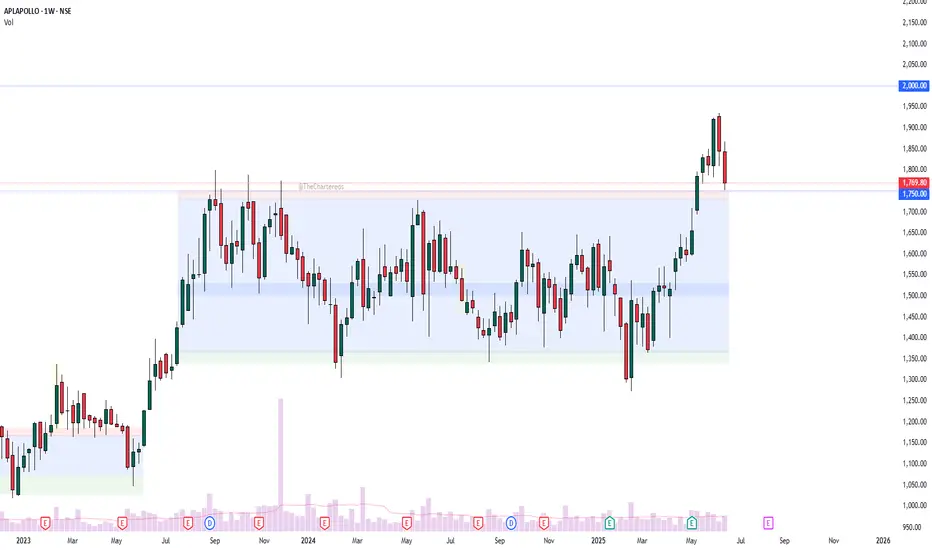
Price consolidated within a tight range for nearly 2 years.
This was followed by a strong breakout accompanied by a notable volume spike.
Currently, the stock appears to be in the retest phase of the breakout zone.
Fundamental Trigger:
📢 APL Apollo Q4 Results: Net profit up 72% YoY; Board approves ₹1,500 Cr capex plan.
What’s next?
Will the retest hold and lead to the next leg up?
Let me know your thoughts 👇
Disclaimer: This analysis is for educational and informational purposes only. It is not investment advice or a recommendation to buy or sell any security. Please do your own research or consult a financial advisor before making any investment decisions. I am not a SEBI-registered advisor.
The structure is quite clear:
Price consolidated within a tight range for nearly 2 years.
This was followed by a strong breakout accompanied by a notable volume spike.
Currently, the stock appears to be in the retest phase of the breakout zone.
Fundamental Trigger:
📢 APL Apollo Q4 Results: Net profit up 72% YoY; Board approves ₹1,500 Cr capex plan.
What’s next?
Will the retest hold and lead to the next leg up?
Let me know your thoughts 👇
Disclaimer: This analysis is for educational and informational purposes only. It is not investment advice or a recommendation to buy or sell any security. Please do your own research or consult a financial advisor before making any investment decisions. I am not a SEBI-registered advisor.
עסקה פעילה
No signs of bounce from the retest zone. The price slumped back in the zone.פרסומים קשורים
כתב ויתור
המידע והפרסומים אינם אמורים להיות, ואינם מהווים, עצות פיננסיות, השקעות, מסחר או סוגים אחרים של עצות או המלצות שסופקו או מאושרים על ידי TradingView. קרא עוד בתנאים וההגבלות.
פרסומים קשורים
כתב ויתור
המידע והפרסומים אינם אמורים להיות, ואינם מהווים, עצות פיננסיות, השקעות, מסחר או סוגים אחרים של עצות או המלצות שסופקו או מאושרים על ידי TradingView. קרא עוד בתנאים וההגבלות.